Page 147 - HaltomCityFY25Budget
P. 147

City Of Haltom City Annual Budget, FY2025                    Propprietary Funds


                                                WATER AND SEWER FUND
                                                   BUDGET SUMMARY
                                                           Actual       Adopted       Projected     Adopted
            FUND  41                                       FY2023        FY2024        FY2024        FY2025
            Cash  &  Investments,  Beginning                    15,615,583          15,295,576          15,295,576          11,172,777
            Revenues:
                Water Sales Revenue                             13,964,696          12,500,000          12,500,000          13,900,000
                Water Service Fees                                   429,581               425,000               425,000               425,000
                Water Connection Fees                                  32,800                 50,000               150,000               100,000
                Sewer Service Revenue                             9,793,681          10,500,000          10,500,000          10,995,000
                Sewer Surcharge Revenue                           1,618,370            1,900,000            1,500,000            1,600,000
                Sewer Connection Fees                                       500                 10,000                      500                      500
                Lab Service Fees                                       54,110                 50,000                 50,000                 50,000
                Penalty Revenue                                      384,954               300,000               350,000               350,000
                Billing Fees                                           33,821                 30,000                 30,000                 35,000
                Interest Income                                      686,029               200,000               600,000               600,000
                Miscellaneous                                        103,541                 88,200                 63,000                 70,300
                   Total Revenues                               27,102,082          26,053,200          26,168,500          28,125,800
            Cash  &  Investments  Available                     42,717,664          41,348,776          41,464,076          39,298,577
            Expenses:
                Public Works Administration                          649,945            1,509,344            1,229,344            1,392,726
                Engineering                                          466,361               585,482               587,127            1,521,212
                Environmental Services                               212,675               488,098               493,598               378,044
                WS Construction                                      293,681               714,725               715,235               451,779
                WS Maintenance                                    2,085,847            2,271,922            2,496,282            2,251,211
                Collection & Distribution                         1,950,561               718,524               720,324               783,415
                Purchased Water                                   4,313,078            5,300,000            5,300,000            5,400,000
                Sewer Treatment Fee                               2,289,906            2,900,000            2,900,000            3,000,000
                Sewer Surcharge Fee                               1,546,900            2,200,000            2,200,000            2,200,000
                Meter Maintenance                                    160,765               285,452               285,452               240,048
                Utility Billing                                   1,035,362               987,031            1,000,211            1,009,212
                Debt Service                                         402,101            1,549,701            1,573,701               769,295
                Non-Departmental                                  6,378,865            7,041,548            6,961,048            7,238,103
                Transfer Out: General Fund (PILOT)                   459,996               528,976               528,976               528,976
                Transfer Out: Water Capital Project Fund            7,400,004            5,800,000            5,800,000            4,000,000
                Transfer Out: Capital Replacement Fund                       -                       -                       -               255,000
                   Total Expenses                               29,646,048          32,880,803          32,791,299          31,419,021
            Non-cash adjustments:
                Depreciation/Amortization/Others                  2,223,960            2,500,000            2,500,000            2,500,000
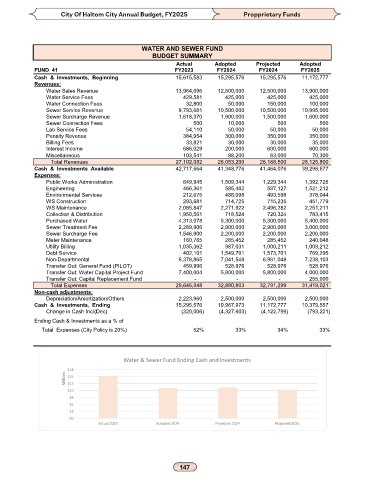
            Cash  &  Investments,  Ending                       15,295,576          10,967,973          11,172,777          10,379,557
                Change in Cash Inc/(Dec)                            (320,006)          (4,327,603)          (4,122,799)             (793,221)
            Ending Cash & Investments as a % of
                 Total  Expenses (City Policy is 20%)            52%           33%           34%           33%


                                          Water & Sewer Fund Ending Cash and Investments

                       $18
                       Millions  $15
                       $13
                       $10
                        $8
                        $5
                        $3
                        $0
                                  Actual 2023        Adopted 2024       Projected 2024      Proposed 2025
   142   143   144   145   146   147   148   149   150   151   152