
Page 58 - CityofGrapevineFY25AdoptedBudget
P. 58
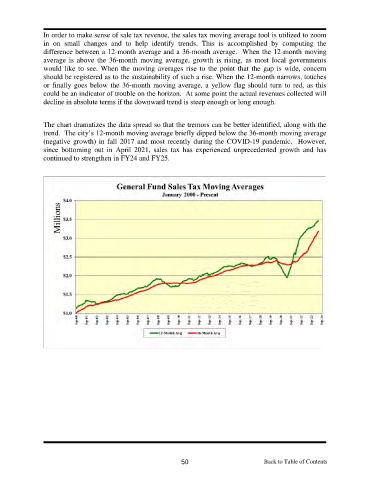
In order to make sense of sale tax revenue, the sales tax moving average tool is utilized to zoom
               in on small changes and to help identify trends. This  is  accomplished by computing the
               difference between a 12-month average and a 36-month average.  When the 12-month moving
               average is above the 36-month moving average, growth is rising,  as  most local  governments
               would like to see. When the moving averages rise to the point that the gap is wide, concern
               should be registered as to the sustainability of such a rise. When the 12-month narrows, touches
               or finally goes below the 36-month moving average, a  yellow flag should turn to red, as this
               could be an indicator of trouble on the horizon.  At some point the actual revenues collected will
               decline in absolute terms if the downward trend is steep enough or long enough.


               The chart dramatizes the data spread so that the tremors can be better identified, along with the
               trend.  The city’s 12-month moving average briefly dipped below the 36-month moving average
               (negative growth) in fall 2017 and most recently during the COVID-19 pandemic.  However,
               since bottoming out in  April 2021, sales tax  has  experienced unprecedented  growth  and has
               continued to strengthen in FY24 and FY25.


                                                             50                         Back  to  Table  of  Contents
                                                                                                    of
                                                                                                      Contents
                                                                                               Table
                                                                                        Back
                                                                                        Back to Table of Contents
                                                                                             to