
Page 56 - CityofGrapevineFY25AdoptedBudget
P. 56
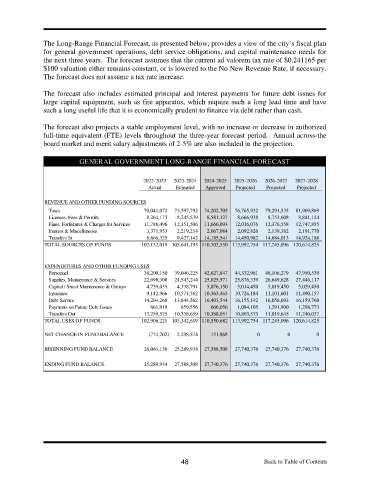
The Long-Range Financial Forecast, as presented below, provides a view of the city’s fiscal plan
               for general government operations, debt service obligations, and capital maintenance needs for
               the next three years.  The forecast assumes that the current ad valorem tax rate of $0.241165 per
               $100 valuation either remains constant, or is lowered to the No New Revenue Rate, if necessary.
               The forecast does not assume a tax rate increase.

               The forecast also includes estimated principal and interest payments for future debt issues for
               large capital equipment, such as fire apparatus, which require such a long lead time and have
               such a long useful life that it is economically prudent to finance via debt rather than cash.

               The forecast also projects a stable employment level, with no increase or decrease in authorized
               full-time equivalent (FTE) levels throughout the three-year forecast period.  Annual across-the
               board market and merit salary adjustments of 2-5% are also included in the projection.

                           GENERAL GOVERNMENT LONG-RANGE FINANCIAL FORECAST


                                                2022-2023  2023-2024  2024-2025  2025-2026  2026-2027  2027-2028
                                                  Actual   Estimated  Approved  Projected  Projected  Projected

                REVENUE AND OTHER FUNDING SOURCES
                 Taxes                           70,041,072  73,597,792  74,202,705  76,765,932  79,291,535  81,909,869
                 Licenses, Fees & Permits         8,264,173  8,245,539  8,581,127  8,666,938  8,753,608  8,841,144
                 Fines, Forfeitures & Charges for Services  11,788,496  12,151,506  11,666,093  12,016,076  12,376,558  12,747,855
                 Interest & Miscellaneous         3,371,953  2,219,214  2,067,084  2,092,826  2,139,382  2,191,770
                 Transfers In                     8,666,325  9,427,142  14,185,541  14,450,982  14,684,013  14,924,188
                TOTAL SOURCES OF FUNDS          102,132,019 105,641,193 110,702,550 113,992,754 117,245,096 120,614,825


                EXPENDITURES AND OTHER FUNDING USES
                 Personnel                       38,200,150  39,046,225  42,627,847  44,332,961  46,106,279  47,950,530
                 Supplies, Maintenance & Services  22,698,308  24,543,244  25,025,571  25,876,339  26,649,628  27,446,117
                 Capital / Street Maintenance & Outlays  4,739,035  4,338,791  5,076,150  5,014,450  5,019,450  5,029,450
                 Insurance                        9,142,966  10,571,582  10,363,463  10,726,184  11,101,601  11,490,157
                 Debt Service                    14,204,268  13,844,562  16,403,544  16,155,142  16,056,693  16,159,760
                 Payments on Future Debt Issues    661,919   659,556   666,056  1,084,105  1,291,800  1,298,773
                 Transfers Out                   13,259,575  10,338,659  10,388,051  10,803,573  11,019,645  11,240,037
                TOTAL USES OF FUNDS             102,906,221 103,342,619 110,550,682 113,992,754 117,245,096 120,614,825

                NET CHANGE IN FUND BALANCE             (774,202)    2,298,574         151,868  0  0                    0

                BEGINNING FUND BALANCE           26,064,136  25,289,934  27,588,508  27,740,376  27,740,376  27,740,376

                ENDING FUND BALANCE              25,289,934  27,588,508  27,740,376  27,740,376  27,740,376  27,740,376


                                                             48                         Back to Table of Contents
                                                                                                    of
                                                                                                    of
                                                                                                      Contents
                                                                                                      Contents
                                                                                               Table
                                                                                        Back
                                                                                        Back
                                                                                             to
                                                                                               Table
                                                                                             to