Page 33 - CityofGrapevineFY25AdoptedBudget
P. 33

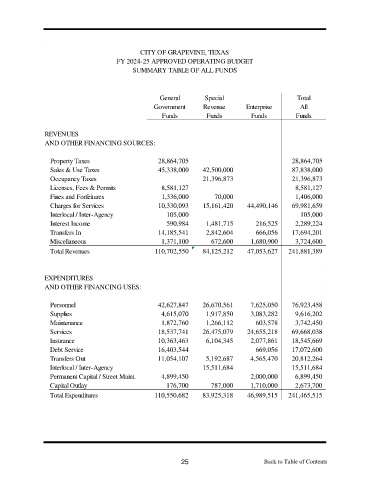
CITY OF GRAPEVINE, TEXAS
                                        FY 2024-25 APPROVED OPERATING BUDGET
                                             SUMMARY TABLE OF ALL FUNDS


                                                      General        Special                       Total
                                                    Government      Revenue       Enterprise        All
                                                       Funds         Funds          Funds          Funds


                REVENUES
                AND OTHER FINANCING SOURCES:


                  Property Taxes                     28,864,705                                   28,864,705
                  Sales & Use Taxes                  45,338,000     42,500,000                    87,838,000
                  Occupancy Taxes                                   21,396,873                    21,396,873
                  Licenses, Fees & Permits            8,581,127                                    8,581,127
                  Fines and Forfeitures               1,336,000         70,000                     1,406,000
                  Charges for Services               10,330,093     15,161,420     44,490,146     69,981,659
                  Interlocal / Inter-Agency             105,000                                     105,000
                  Interest Income                       590,984      1,481,715        216,525      2,289,224
                  Transfers In                       14,185,541      2,842,604        666,056     17,694,201
                  Miscellaneous                       1,371,100        672,600      1,680,900      3,724,600
                  Total Revenues                    110,702,550     84,125,212     47,053,627   241,881,389


                EXPENDITURES
                AND OTHER FINANCING USES:


                  Personnel                          42,627,847     26,670,561      7,625,050     76,923,458
                  Supplies                            4,615,070      1,917,850      3,083,282      9,616,202
                  Maintenance                         1,872,760      1,266,112        603,578      3,742,450
                  Services                           18,537,741     26,475,079     24,655,218     69,668,038
                  Insurance                          10,363,463      6,104,345      2,077,861     18,545,669
                  Debt Service                       16,403,544                       669,056     17,072,600
                  Transfers Out                      11,054,107      5,192,687      4,565,470     20,812,264
                  Interlocal / Inter-Agency                         15,511,684                    15,511,684
                  Permanent Capital / Street Maint.   4,899,450                     2,000,000      6,899,450
                  Capital Outlay                        176,700        787,000      1,710,000      2,673,700
                  Total Expenditures                110,550,682     83,925,318     46,989,515   241,465,515


                                                             25                         Back  to  Table  of  Contents
                                                                                               Table
                                                                                                    of
                                                                                                      Contents
                                                                                        Back
                                                                                        Back to Table of Contents
                                                                                             to
   28   29   30   31   32   33   34   35   36   37   38