Page 31 - CityofGrapevineFY25AdoptedBudget
P. 31

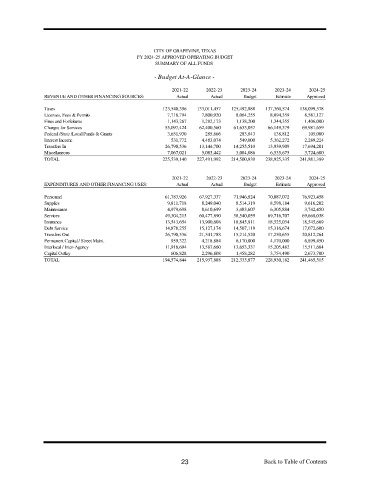
CITY OF GRAPEVINE, TEXAS
                                              FY 2024-25 APPROVED OPERATING BUDGET
                                                    SUMMARY OF ALL FUNDS

                                                    - Budget At-A-Glance -

                                                          2021-22    2022-23     2023-24    2023-24    2024-25
                REVENUE AND OTHER FINANCING SOURCES:       Actual      Actual     Budget    Estimate  Approved

                Taxes                                  123,540,396  133,011,457  125,492,888  137,360,574  138,099,578
                Licenses, Fees & Permits                7,716,794   7,800,920  8,064,255  8,094,359   8,581,127
                Fines and Forfeitures                   1,143,267   1,282,173  1,138,200  1,344,355   1,406,000
                Charges for Services                    55,097,424  62,400,560  61,633,057  66,149,379  69,981,659
                Federal /State /Local Funds & Grants    3,651,930    285,666    283,843     138,812    105,000
                Interest Income                           531,772   4,483,074   549,000   5,362,272   2,289,224
                Transfers In                            26,790,536  13,144,700  14,255,510  13,939,909  17,694,201
                Miscellaneous                           7,067,021   5,083,442  3,084,086  6,535,675   3,724,600
                TOTAL                                  225,539,140  227,491,992  214,500,839  238,925,335  241,881,389


                                                          2021-22    2022-23     2023-24    2023-24    2024-25
                EXPENDITURES AND OTHER FINANCING USES:     Actual      Actual     Budget    Estimate  Approved

                Personnel                               61,783,926  67,927,337  71,946,824  70,087,072  76,923,458
                Supplies                                9,811,718   8,249,040  8,514,319  8,598,184   9,616,202
                Maintenance                             4,979,698   8,610,699  3,483,607  6,305,884   3,742,450
                Services                                49,304,213  60,477,890  58,540,059  69,716,707  69,668,038
                Insurance                               13,543,654  13,900,608  18,845,811  18,525,034  18,545,669
                Debt Service                            14,878,255  15,127,174  14,507,118  15,316,674  17,072,600
                Transfers Out                           26,790,536  21,541,788  15,214,520  17,250,655  20,812,264
                Permanent Capital / Street Maint.         959,322   4,218,884  6,170,000  4,170,000   6,899,450
                Interlocal / Inter-Agency               11,916,694  13,587,660  13,653,337  15,205,482  15,511,684
                Capital Outlay                            606,828   2,296,808  1,458,282  3,754,490   2,673,700
                TOTAL                                  194,574,844  215,937,888  212,333,877  228,930,182  241,465,515


                                                             23                         Back  to  Table  of  Contents
                                                                                               Table
                                                                                                    of
                                                                                                      Contents
                                                                                        Back to Table of Contents
                                                                                        Back
                                                                                             to
   26   27   28   29   30   31   32   33   34   35   36