
Page 65 - FY 2024-25 ADOPTED BUDGET
P. 65
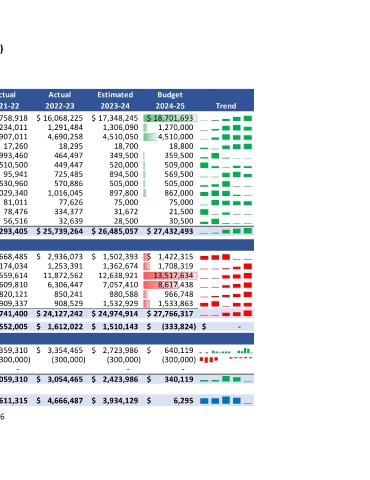
TEN YEAR COMPARISON OF REVENUES AND EXPENDITURES

 OPERATING FUNDS (GENERAL FUND AND DEBT SERVICE FUND)

 FY 2015-16 TO 2024-25


 Actual  Actual  Actual          Estimated           Budget
 Revenues by Source     2020-21  2021-22  2022-23  2023-24  2024-25     Trend

 Ad Valorem Taxes  $   14,098,749  $   14,758,918  $   16,068,225  $   17,348,245  $   18,701,693
 Franchise Taxes  1,208,965  1,234,011  1,291,484  1,306,090  1,270,000
 Sales & Other Taxes  3,402,472  3,907,011  4,690,258  4,510,050  4,510,000
 Licenses  17,588  17,260  18,295      18,700            18,800
 Permits and Filing Fees  486,461  993,460  464,497  349,500  359,500
 Fines and Forfeitures  617,919  510,500  449,447  520,000  509,000
 Use of Money and Property  66,436  95,941  725,485  894,500  569,500
 Revenue from Other Agencies  518,927  530,960  570,886  505,000  505,000
 Citizen Services  989,714  1,029,340  1,016,045  897,800  862,000
 Recreation Services  56,716  81,011  77,626  75,000     75,000
 Sale of Goods  814,497  78,476  334,377  31,672         21,500
 Other Revenue  39,433  56,516  32,639  28,500           30,500
 TOTAL REVENUE    $   22,317,877  $   23,293,405  $   25,739,264  $   26,485,057  $   27,432,493

 Expenditures by Function
 General Government  $     2,455,048  $     2,668,485  $     2,936,073  $     1,502,393  $     1,422,315
 Staff Services  1,159,286  1,174,034  1,253,391          1,362,674          1,708,319
 Public Safety  9,563,971  9,559,614  11,872,562       12,638,921       13,517,634
 Public Services  4,286,396  4,609,810  6,306,447          7,057,410          8,617,438
 Community Development  776,038  820,121  850,241              880,588              966,748
 Debt Service  1,605,259  1,909,337  908,529  1,532,929  1,533,863
 TOTAL EXPENDITURES  $   19,845,998  $   20,741,400  $   24,127,242  $   24,974,914  $   27,766,317

 VARIANCE REVENUES VERSUS EXPENDITURES    $     2,471,879  $     2,552,005  $     1,612,022  $     1,510,143  $        (333,824) $                   -
 Other Financing Sources

 Transfers-In     $     1,546,514  $     1,359,310  $     3,354,465  $     2,723,986  $         640,119
 Transfers-Out  (500,000)  (300,000)  (300,000)  (300,000)  (300,000)
 Adjustments                       -                       -                       -                       -

 TOTAL OTHER FINANCING SOURCES (USES)    $     1,046,514  $     1,059,310  $     3,054,465  $     2,423,986  $         340,119


 VARIANCE REVENUES VERSUS EXPENDITURES    $     3,518,393  $     3,611,315  $     4,666,487  $     3,934,129  $              6,295

 56