
Page 52 - Bedford-FY24-25 Budget
P. 52
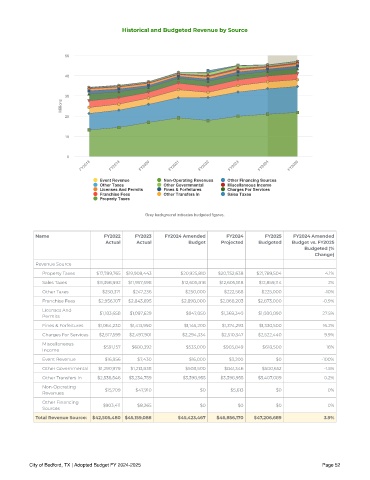
Historical and Budgeted Revenue by Source


                       50


                       40


                       30
                     Millions


                       20


                       10


                       0
                            FY2018    FY2019   FY2020    FY2021    FY2022    FY2023    FY2024    FY2025


                                  Event Revenue        Non-Operating Revenues  Other Financing Sources
                                  Other Taxes          Other Governmental   Miscellaneous Income
                                  Licenses And Permits  Fines & Forfeitures  Charges For Services
                                  Franchise Fees       Other Transfers In   Sales Taxes
                                  Property Taxes

                                                 Grey background indicates budgeted figures.


             Name                  FY2022     FY2023   FY2024 Amended       FY2024       FY2025   FY2024 Amended
                                    Ac tual   Ac tual          Budget     Projec ted   Budgeted   Budget vs. FY2025
                                                                                                      Budgeted (%
                                                                                                         Change)
             Revenue Source
               Property Taxes    $17,789,765  $19,908,443    $20,925,810  $20,752,638  $21,789,504           4.1%
               Sales Taxes       $11,398,992  $11,957,598    $12,605,818  $12,605,818  $12,859,114            2%
               Other Taxes         $238,371  $247,236         $250,000     $222,568     $225,000            -10%
               Franchise Fees     $2,956,107  $2,843,695     $2,898,000   $2,868,203  $2,873,000            -0.9%
               Licenses And       $1,183,658  $1,097,629      $847,850    $1,369,340  $1,080,890            27.5%
               Permits
               Fines & Forfeitures  $1,064,230  $1,413,990    $1,145,200  $1,374,293   $1,330,500           16.2%
               Charges For Services  $2,517,599  $2,497,901  $2,294,334   $2,510,347  $2,522,440            9.9%
               Miscellaneous       $591,157  $680,392          $533,000    $903,849     $618,500             16%
               Income
               Event Revenue        $16,956   $7,430            $16,000      $3,200         $0             -100%
               Other Governmental  $1,290,979  $1,213,838     $508,500     $841,346     $500,652            -1.5%
               Other Transfers In  $2,538,546  $3,234,759     $3,398,955  $3,398,955  $3,407,089            0.2%
               Non-Operating        $15,709   $47,910              $0        $5,613         $0               0%
               Revenues
               Other Financing     $903,411   $8,265               $0           $0          $0               0%
               Sources
             Total Revenue Source:  $ 42 ,505,4 80  $ 45,159,088  $ 45,423,467  $ 46 , 856 ,170  $ 47, 206 ,689  3.9%


           City of Bedford, TX | Adopted Budget FY 2024-2025                                                Page 52