
Page 435 - Bedford-FY24-25 Budget
P. 435
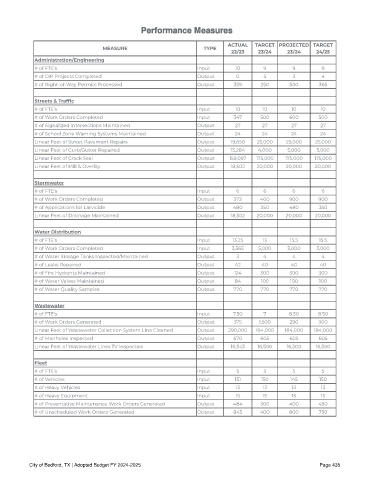
Performance Measures


                                                                            ACTUAL   TARGET  PROJECTED   TARGET
                                   MEASURE                          TYPE
                                                                              22 /23  23/24     23/24     24 /25

            Administration/Engineering
            # of FTE's                                            Input        10       9         9        9
            # of CIP Projects Completed                           Output       0        5         3        4
            # of Right-of-Way Permits Processed                   Output      359      250       500       365


            Streets & Traf{c
            # of FTE's                                            Input        10       10       10        10
            # of Work Orders Completed                            Input       347      500       600      500
            # of Signalized Intersections Maintained              Output       27       27       27        27
            # of School Zone Warning Systems Maintained           Output       24       24       24        24
            Linear Feet of Street Pavement Repairs                Output     19,650   25,000    25,000   25,000
            Linear Feet of Curb/Gutter Repaired                   Output     15,284   4,000     5,000     5,000
            Linear Feet of Crack Seal                             Output     159,097  175,000  175,000   175,000
            Linear Feet of Mill & Overlay                         Output     18,502   20,000    20,000   20,000


            Stormwater
            # of FTE's                                            Input        6        6         6        6
            # of Work Orders Completed                            Output      372      400       900      900
            # of Applications for Larvicide                       Output      480      350       480       350
            Linear Feet of Drainage Maintained                    Output     18,502   20,000    20,000   20,000


            Water Distribution
            # of FTE's                                            Input       13.25     13       15.5      15.5
            # of Work Orders Completed                            Input       3,565   5,000     3,000     3,000
            # of Water Storage Tanks Inspected/Maintained         Output       3        4         4        4
            # of Leaks Repaired                                   Output       42       40       40        40
            # of Fire Hydrants Maintained                         Output      124      300       300      300
            # of Water Valves Maintained                          Output       84      100       100       100
            # of Water Quality Samples                            Output      770      770       770      770


            Wastewater
            # of FTE's                                            Input       7.50      7        8.50     8.50
            # of Work Orders Generated                            Output      375      1,500     290      300
            Linear Feet of Wastewater Collection System Line Cleaned  Output  290,000  184,000  184,000  184,000
            # of Manholes Inspected                               Output      670      605       605      605
            Linear Feet of Wastewater Lines TV Inspected          Output     16,543   16,500    16,500   16,500


            Fleet
            # of FTE's                                            Input        5        3         5        5
            # of Vehicles                                         Input        151     150       145       150
            # of Heavy Vehicles                                   Input        13       13        13       13
            # of Heavy Equipment                                  Input        15       15        15       15
            # of Preventative Maintenance Work Orders Generated   Output      484      300       400      450
            # of Unscheduled Work Orders Generated                Output      845      400       800      750


           City of Bedford, TX | Adopted Budget FY 2024-2025                                               Page 435