Page 41 - Bedford-FY24-25 Budget
P. 41

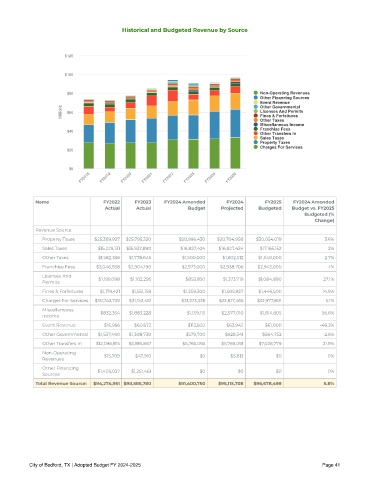
Historical and Budgeted Revenue by Source


                       $120


                       $100


                       $80                                                             Non-Operating Revenues
                                                                                       Other Financing Sources
                                                                                       Event Revenue
                                                                                       Other Governmental
                     Millions  $60                                                     Licenses And Permits
                                                                                       Fines & Forfeitures
                                                                                       Other Taxes
                                                                                       Miscellaneous Income
                                                                                       Franchise Fees
                       $40
                                                                                       Other Transfers In
                                                                                       Sales Taxes
                                                                                       Property Taxes
                                                                                       Charges For Services
                       $20
                        $0
                            FY2018  FY2019  FY2020  FY2021  FY2022  FY2023  FY2024  FY2025


             Name                  FY2022     FY2023   FY2024 Amended       FY2024       FY2025   FY2024 Amended
                                    Ac tual   Ac tual          Budget     Projec ted   Budgeted   Budget vs. FY2025
                                                                                                      Budgeted (%
                                                                                                         Change)
             Revenue Source
               Property Taxes   $25,389,927  $25,795,320    $28,996,430  $28,704,958  $30,054,019           3.6%
               Sales Taxes       $15,229,131  $15,932,890    $16,827,424  $16,827,424  $17,165,152            2%
               Other Taxes        $1,582,336  $1,778,645     $1,500,000    $1,602,512  $1,540,000           2.7%
               Franchise Fees    $3,046,938  $2,904,190      $2,973,000   $2,938,706  $2,943,000             -1%
               Licenses And       $1,199,098  $1,102,295      $853,850     $1,373,719  $1,084,890           27.1%
               Permits
               Fines & Forfeitures  $1,179,421  $1,551,159    $1,259,300  $1,505,927   $1,446,500           14.9%
               Charges For Services  $30,743,739  $31,152,412  $31,373,336  $32,817,465  $32,977,801         5.1%
               Miscellaneous      $832,354  $1,883,228         $1,159,115  $2,577,010  $1,814,605           56.6%
               Income
               Event Revenue       $16,956   $60,672           $113,500     $63,942      $61,000           -46.3%
               Other Governmental  $1,537,490  $1,308,730     $579,700     $929,341     $564,752            -2.6%
               Other Transfers In  $12,096,815  $5,816,867   $5,765,095   $5,769,091   $7,026,779           21.9%
               Non-Operating       $15,709    $47,910              $0        $5,613         $0               0%
               Revenues
               Other Financing   $1,405,037  $1,251,461            $0           $0          $0               0%
               Sources
             Total Revenue Source:  $94 , 274 ,951  $90,585,780  $91,400,750  $95,115,708  $96 ,678 ,498    5. 8%


           City of Bedford, TX | Adopted Budget FY 2024-2025                                                Page 41
   36   37   38   39   40   41   42   43   44   45   46