
Page 48 - FY 24 Budget Forecast at Adoption.xlsx
P. 48
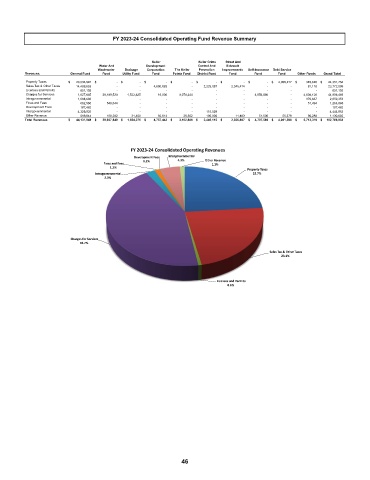
FY 2023-24 Consolidated Operating Fund Revenue Summary


                                                    Keller         Keller Crime    Street And
                                   Water And     Development      Control And   Sidewalk
                                 Wastewater    Drainage   Corporation    The Keller   Prevention   Improvements    Self-Insurance    Debt Service
         Revenues:       General Fund   Fund   Utility Fund   Fund   Pointe Fund   District Fund   Fund   Fund   Fund    Other Funds   Grand Total
          Property Taxes  $         20,034,941  $                         -  $                     -  $                         -  $                        -  $                       -  $                          -  $                       -  $       4,006,217  $            310,626  $          24,351,784
          Sales Tax & Other Taxes             14,429,652                             -                         -                4,690,828                            -            2,225,087                2,345,414                           -                           -                  81,118            23,772,099

          Licenses and Permits                   651,103                             -                         -                             -                            -                            -                              -                           -                           -                           -                   651,103

          Charges for Services                1,627,685             29,199,523           1,522,825                   16,000               3,076,244                            -                              -           4,656,086                           -             4,808,126            44,906,489
          Intragovernmental                1,688,686                             -                         -                             -                            -                            -                              -                         -                             -                370,667              2,059,353
          Fines and Fees                   662,550                 549,044                         -                             -                            -                          -                                -                         -                             -                  51,494              1,263,088

          Development Fees                 187,462                             -                         -                             -                            -                            -                              -                           -                           -                           -                   187,462

          Intergovernmental                4,329,925                             -                         -                             -                            -               115,028                              -                           -                           -                           -                4,444,953


          Other Revenue                   519,044                 189,282               31,450                   50,614                  26,562               105,000                     11,483                51,500                55,379                  90,288              1,130,602

         Total Revenues  $         44,131,048  $         29,937,849  $       1,554,275  $          4,757,442  $          3,102,806  $        2,445,115  $            2,356,897  $       4,707,586  $       4,061,596  $         5,712,319  $       102,766,933
                                            FY 2023-24 Consolidated Operating Revenues
                                             Development Fees   Intergovernmental
                                                0.2%        4.3%     Other Revenue
                                   Fines and Fees                      1.1%
                                     1.2%
                                                                                   Property Taxes
                                 Intragovernmental                                   23.7%
                                    2.0%


                        Charges for Services
                           43.7%
                                                                                          Sales Tax & Other Taxes
                                                                                              23.1%


                                                                         Licenses and Permits
                                                                            0.6%


                                                             46