Page 60 - GrapevineFY24 Adopted Budget
P. 60

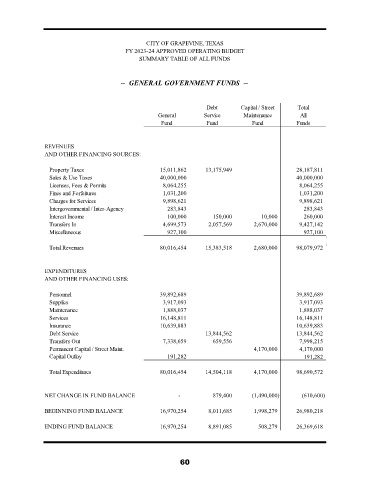
CITY OF GRAPEVINE, TEXAS
                                           FY 2023-24 APPROVED OPERATING BUDGET
                                               SUMMARY TABLE OF ALL FUNDS


                                         --  GENERAL GOVERNMENT FUNDS  --


                                                                     Debt        Capital / Street  Total
                                                     General         Service      Maintenance       All
                                                      Fund           Fund           Fund           Funds


                REVENUES
                AND OTHER FINANCING SOURCES:

                 Property Taxes                       15,011,862     13,175,949                    28,187,811
                 Sales & Use Taxes                    40,000,000                                   40,000,000
                 Licenses, Fees & Permits              8,064,255                                    8,064,255
                 Fines and Forfeitures                 1,031,200                                    1,031,200
                 Charges for Services                  9,898,621                                    9,898,621
                 Intergovernmental / Inter-Agency       283,843                                       283,843
                 Interest Income                        100,000        150,000         10,000         260,000
                 Transfers In                          4,699,573      2,057,569      2,670,000      9,427,142
                 Miscellaneous                          927,100                                       927,100

                 Total Revenues                       80,016,454     15,383,518      2,680,000     98,079,972


                EXPENDITURES
                AND OTHER FINANCING USES:

                 Personnel                            39,892,689                                   39,892,689
                 Supplies                              3,917,093                                    3,917,093
                 Maintenance                           1,888,037                                    1,888,037
                 Services                             16,148,811                                   16,148,811
                 Insurance                            10,639,883                                   10,639,883
                 Debt Service                                        13,844,562                    13,844,562
                 Transfers Out                         7,338,659       659,556                      7,998,215
                 Permanent Capital / Street Maint.                                   4,170,000      4,170,000
                 Capital Outlay                         191,282                                       191,282

                 Total Expenditures                   80,016,454     14,504,118      4,170,000     98,690,572


                NET CHANGE IN FUND BALANCE                               -                  879,400            (1,490,000)               (610,600)

                BEGINNING FUND BALANCE                16,970,254      8,011,685      1,998,279     26,980,218

                ENDING FUND BALANCE                   16,970,254      8,891,085                 508,279  26,369,618


                                                             60
   55   56   57   58   59   60   61   62   63   64   65