
Page 390 - Bedford-FY22-23 Budget
P. 390
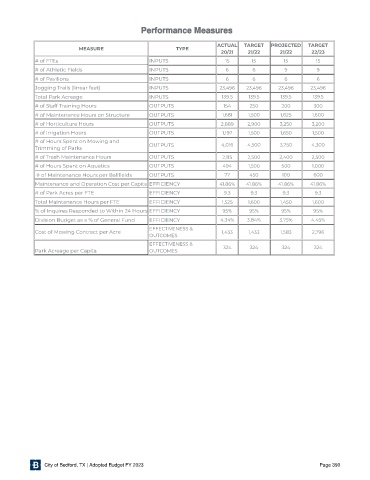
Performance Measures


                                                                         ACTUAL   TARGET   PROJECTED   TARGET
                           MEASURE                         TYPE
                                                                          20/21    21/22      21/22     22 /23
             # of FTEs                            INPUTS                   15       15         15         15
             # of Athletic Fields                 INPUTS                    6        6         9          9
             # of Pavilions                       INPUTS                    6        6         6          6
             Jogging Trails (linear feet)         INPUTS                  23,496   23,496    23,496     23,496
             Total Park Acreage                   INPUTS                  139.5    139.5      139.5     139.5
             # of Staff Training Hours            OUTPUTS                  154      250       200        300
             # of Maintenance Hours on Structure  OUTPUTS                  1,681   1,500      1,625     1,600
             # of Horticulture Hours              OUTPUTS                 2,889    2,900      3,250     3,200
             # of Irrigation Hours                OUTPUTS                  1,197   1,500      1,650     1,500
             # of Hours Spent on Mowing and
             Trimming of Parks                    OUTPUTS                 4,016    4,500      3,750     4,300
             # of Trash Maintenance Hours         OUTPUTS                  2,115   2,500     2,400      2,500
             # of Hours Spent on Aquatics         OUTPUTS                  494     1,500      500       1,000
              # of Maintenance Hours per Ball elds  OUTPUTS                77       450       100        600
             Maintenance and Operation Cost per Capita EFFICIENCY         41.86%  41.86%     41.86%     41.86%
             # of Park Acres per FTE              EFFICIENCY               9.3      9.3        9.3       9.3
             Total Maintenance Hours per FTE      EFFICIENCY              1,525    1,600      1,450     1,600
             % of Inquires Responded to Within 24 Hours EFFICIENCY         95%     95%        95%        95%
             Division Budget as a % of General Fund  EFFICIENCY           4.34%    3.84%      3.75%     4.45%
                                                  EFFECTIVENESS &
             Cost of Mowing Contract per Acre                             1,433    1,433      1,583     2,796
                                                  OUTCOMES
                                                  EFFECTIVENESS &
             Park Acreage per Capita              OUTCOMES                 324      324       324        324


                City of Bedford, TX | Adopted Budget FY 2023                                               Page 390