
Page 314 - Bedford-FY22-23 Budget
P. 314
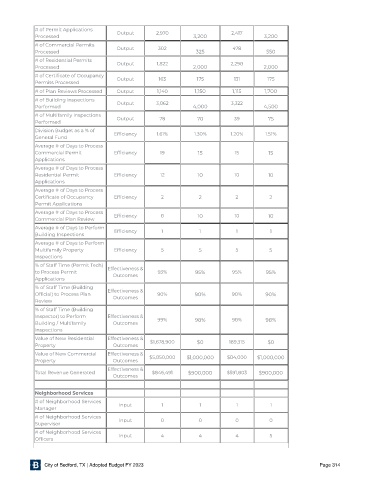
# of Permit Applications
             Processed                  Output       2,970       3,200        2,417     3,200
             # of Commercial Permits    Output       302                      478
             Processed                                            325                    550
             # of Residential Permits   Output       1,822                   2,298
             Processed                                           2,000                  2,000
             # of Certi cate of Occupancy
             Permits Processed          Output        163         175         131         175
             # of Plan Reviews Processed  Output     1,140       1,150        1,115      1,700
             # of Building Inspections  Output       3,862                   3,322
             Performed                                           4,000                  4,500
             # of Multifamily Inspections
             Performed                  Output        78          70          39          75
             Division Budget as a % of  Ef ciency    1.61%       1.30%       1.20%       1.51%
             General Fund
             Average # of Days to Process
             Commercial Permit         Ef ciency      19          15           15         15
             Applications
             Average # of Days to Process
             Residential Permit        Ef ciency      12          10           10         10
             Applications
             Average # of Days to Process
             Certi cate of Occupancy   Ef ciency      2            2           2          2
             Permit Applications
             Average # of Days to Process  Ef ciency  8           10           10         10
             Commercial Plan Review
             Average # of Days to Perform  Ef ciency  1            1           1          1
             Building Inspections
             Average # of Days to Perform
             Multifamily Property      Ef ciency      5            5           5          5
             Inspections
             % of Staff Time (Permit Tech)  Effectiveness &
             to Process Permit                       93%          95%         95%        95%
             Applications             Outcomes
             % of Staff Time (Building
             Of cial) to Process Plan  Effectiveness &  90%      90%          90%        90%
                                      Outcomes
             Review
             % of Staff Time (Building
             Inspector) to Perform   Effectiveness &
             Building / Multifamily   Outcomes       99%          98%         98%        98%
             Inspections
             Value of New Residential  Effectiveness &  $1,678,900  $0       189,315      $0
             Property                 Outcomes
             Value of New Commercial  Effectiveness &
             Property                 Outcomes    $5,850,000   $1,000,000   $84,000   $1,000,000
                                     Effectiveness &
             Total Revenue Generated               $846,491    $900,000     $591,803   $900,000
                                      Outcomes


             Neighborhood Ser vices
             # of Neighborhood Services  Input        1            1           1          1
             Manager
             # of Neighborhood Services
             Supervisor                 Input         0            0           0          0
             # of Neighborhood Services  Input        4            4           4          5
             Of cers


                City of Bedford, TX | Adopted Budget FY 2023                                               Page 314