
Page 312 - Bedford-FY22-23 Budget
P. 312
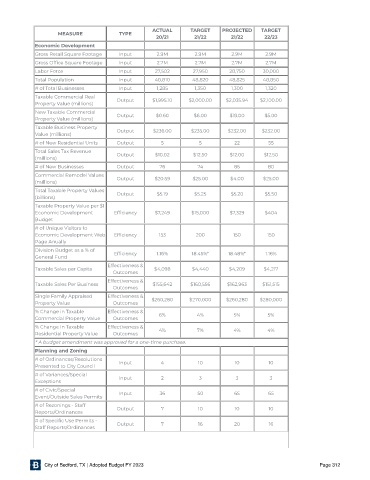
ACTUAL       TARGET    PROJECTED    TARGET
                    MEASURE             TYPE
                                                     20/21       21/22       21/22       22 /23

             Economic Development
             Gross Retail Square Footage  Input      2.9M        2.9M         2.9M       2.9M
             Gross Of ce Square Footage  Input       2.7M        2.7M         2.7M       2.7M
             Labor Force                Input       27,502       27,950      28,750     30,000
             Total Population           Input       48,810       48,820      48,825     48,850
             # of Total Businesses      Input        1,285       1,350        1,300      1,320
             Taxable Commercial Real    Output     $1,995.10   $2,000.00    $2,035.94  $2,100.00
             Property Value (millions)
             New Taxable Commercial
             Property Value (millions)  Output       $0.60       $6.00       $18.00      $5.00
             Taxable Business Property  Output      $236.00     $235.00     $232.00     $232.00
             Value (millions)
             # of New Residential Units  Output       5            5           22         55
             Total Sales Tax Revenue    Output      $10.02       $12.50      $12.00     $12.50
             (millions)
             # of New Businesses        Output        76          74           85         80
             Commercial Remodel Values
             (millions)                 Output      $20.59       $25.00      $4.00      $25.00
             Total Taxable Property Values  Output   $5.19       $5.25       $5.20       $5.50
             (billions)
             Taxable Property Value per $1
             Economic Development      Ef ciency    $7,249      $15,000      $7,329      $404
             Budget
             # of Unique Visitors to
             Economic Development Web  Ef ciency      153         200         150        150
             Page Anually
             Division Budget as a % of
             General Fund              Ef ciency     1.16%      18.45%*      18.48%*     1.16%
                                     Effectiveness &
             Taxable Sales per Capita               $4,098       $4,440      $4,209     $4,217
                                      Outcomes
                                     Effectiveness &
             Taxable Sales Per Business            $155,642     $160,556    $162,963    $151,515
                                      Outcomes
             Single Family Appraised  Effectiveness &  $260,280  $270,000   $260,280   $280,000
             Property Value           Outcomes
             % Change in Taxable     Effectiveness &
             Commercial Property Value  Outcomes      6%          4%          5%          5%
             % Change in Taxable     Effectiveness &  4%          7%          4%          4%
             Residential Property Value  Outcomes
             * A budget amendment was approved for a one-time purchase.

             Planning and Zoning
             # of Ordinances/Resolutions
             Presented to City Council  Input         4            10          10         10
             # of Variances/Special
             Exceptions                 Input         2            3           3          3
             # of Civic/Special         Input         36          50           65         65
             Event/Outside Sales Permits
             # of Rezonings - Staff     Output        7            10          10         10
             Reports/Ordinances
             # of Speci c Use Permits -
             Staff Reports/Ordinances   Output        7            16         20          16


                City of Bedford, TX | Adopted Budget FY 2023                                               Page 312