
Page 10 - Bedford-FY22-23 Budget
P. 10
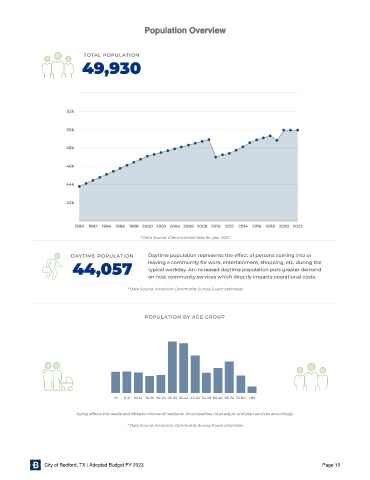
Population Overview


                             T  O T A L     P  O  P U  L A T  I  O  N
                            49,930


                       52k


                       50k


                       4 8k

                       46k


                       44k


                       42k


                          1990  1992  1994  1996  1998  2000  2002  2004  2006  2008  2010  2012  2014  2016  2018  2020  2022
                                               * Data Source: Client entered data for year 2022


                                                  Daytime population represents the effect of persons coming into or
                        D A Y T I  M  E   P O  P  U  L  A T I O  N
                                                  leaving a community for work , enter tainment , shopping, etc . during the
                         44,057                   typical workday. An increased daytime population puts greater demand
                                                  on host community ser vices which directly impacts operational costs.

                                           * Data Source: American Community Sur vey 5-year estimates


                                                 P  O P U L  A T  I O N    B Y     A  G  E   G  R O U P


                                       <5  5-9  10 -14  15-19  20 -24  25-34  35- 44  45-54  55-59  60 - 64  65-74  75-84  >85


                          Aging affec ts the needs and lifestyle choices of residents. Municipalities must adjust and plan ser vices accordingly.
                                           * Data Source: American Community Sur vey 5-year estimates


                City of Bedford, TX | Adopted Budget FY 2023                                                Page 10