
Page 536 - FortWorthFY22AdoptedBudget
P. 536
City Profile
Key indicators show that growth and development in the Fort Worth-Arlington-Grapevine area is expected to occur
at a pace significantly faster than the nationwide rate with employment projecting to grow by roughly 128,000 net
new positions, led by the service sector.
LABOR FORCE
The Fort Worth-Arlington MD boasts a strong labor force of 1.2 million that continues to grow. The Fort Worth-
Arlington MD has experienced positive annual employment growth since summer 2010 up until the Covid-19
pandemic in early 2020. In the wake of the crisis, the city’s unemployment rate of 7.9% was slightly higher than the
6.8% state unemployment rate but below the 8.4% national unemployment rate through August 2020. In 2021, the
City’s unemployment rate decrased dramatically to 4.8% which is lower than the state umemployment rate of 5.6%
and equal to the national employment rate.
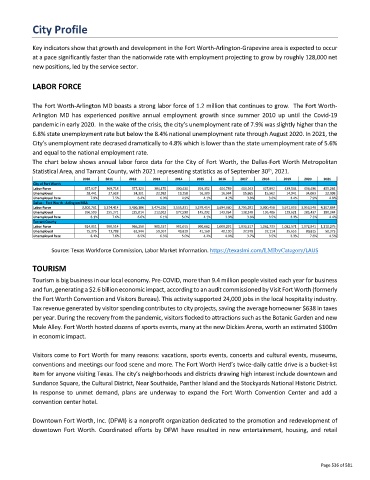
The chart below shows annual labor force data for the City of Fort Worth, the Dallas-Fort Worth Metropolitan
th
Statistical Area, and Tarrant County, with 2021 representing statistics as of September 30 , 2021.
2010 2011 2012 2013 2014 2015 2016 2017 2018 2019 2020 2021
City of Fort Worth
Labor Force 357,927 369,718 377,123 384,170 390,430 393,352 404,789 414,163 427,892 439,544 436,496 455,244
Unemployed 28,441 27,628 24,301 22,982 19,258 16,303 16,984 15,865 15,562 14,941 34,063 22,008
Unemployed Rate 7.9% 7.5% 6.4% 6.0% 4.9% 4.1% 4.2% 3.8% 3.6% 3.4% 7.9% 4.8%
Dallas - Fort Worth - Arlington MSA
Labor Force 3,300,761 3,374,414 3,420,186 3,474,226 3,535,331 3,579,454 3,694,960 3,795,291 3,900,458 3,971,633 3,953,549 4,107,884
Unemployed 266,593 255,271 225,014 212,012 177,598 145,292 143,064 138,248 136,486 129,621 285,437 180,344
Unemployed Rate 8.1% 7.6% 6.6% 6.1% 5.0% 4.1% 3.9% 3.6% 3.5% 3.3% 7.3% 4.4%
Tarrant County
Labor Force 924,951 950,514 966,259 981,537 991,015 990,682 1,009,291 1,033,317 1,062,733 1,082,571 1,072,941 1,110,275
Unemployed 75,375 71,788 62,944 59,367 49,829 41,169 40,130 37,978 37,114 35,655 80,815 50,373
Unemployed Rate 8.1% 7.6% 6.5% 6.5% 5.0% 4.2% 4.0% 3.7% 3.5% 3.3% 7.6% 4.5%
Source: Texas Workforce Commission, Labor Market Information. https://texaslmi.com/LMIbyCategory/LAUS
TOURISM
Tourism is big business in our local economy. Pre-COVID, more than 9.4 million people visited each year for business
and fun, generating a $2.6 billion economic impact, according to an audit commissioned by Visit Fort Worth (formerly
the Fort Worth Convention and Visitors Bureau). This activity supported 24,000 jobs in the local hospitality industry.
Tax revenue generated by visitor spending contributes to city projects, saving the average homeowner $638 in taxes
per year. During the recovery from the pandemic, visitors flocked to attractions such as the Botanic Garden and new
Mule Alley. Fort Worth hosted dozens of sports events, many at the new Dickies Arena, worth an estimated $100m
in economic impact.
Visitors come to Fort Worth for many reasons: vacations, sports events, concerts and cultural events, museums,
conventions and meetings our food scene and more. The Fort Worth Herd’s twice-daily cattle drive is a bucket-list
item for anyone visiting Texas. The city’s neighborhoods and districts drawing high interest include downtown and
Sundance Square, the Cultural District, Near Southside, Panther Island and the Stockyards National Historic District.
In response to unmet demand, plans are underway to expand the Fort Worth Convention Center and add a
convention center hotel.
Downtown Fort Worth, Inc. (DFWI) is a nonprofit organization dedicated to the promotion and redevelopment of
downtown Fort Worth. Coordinated efforts by DFWI have resulted in new entertainment, housing, and retail
Page 536 of 581