
Page 237 - Microsoft Word - FY 2022 Adopted Budget Document
P. 237
Special Revenue Funds Return to Table of Contents
Return to Table of Contents
PARK PERFORMANCE FUND: Mike Hunter, Interim Director
Department Narrative At A Glance
The Park Performance Fund provides for 93 Authorized Positions
the City’s recreation and rental Budget Break Down
programs. Park Performance Fund Personnel Services $10,752,860
divisions include: Athletics, Aquatics, Operating Expenses 5,691,524
Recreation Centers, Rental and Lake Capital Outlay 708,520
Services, Golf, and Tennis. Total $17,152,904
Performance Fund resources are
managed and deployed in accordance Budget Highlights
with the following strategic focus areas:
2 New Line Cooks $76,965 (Offset)
Building a Thriving Community One-time Funding for Tierra Verde Golf Club Improvements $755,000
Coordinate programs to support Increased Recurring Funding for EAST Indoor Pool Staffing $42,210
youth, seniors and families
Facility investment and
programming aimed at revenue
generation, and
Cost recovery
Each year the goal of cost recovery is
more difficult to attain. Socioeconomic
changes, competition in the marketplace
and increasing labor rates pose the
greatest challenges.
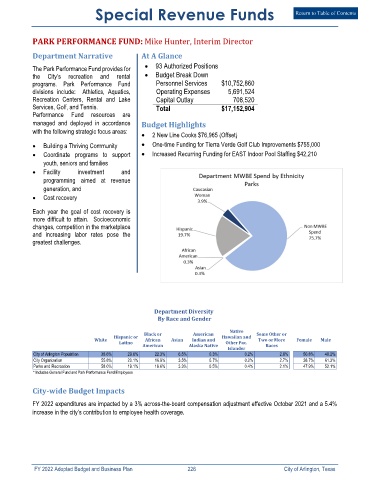
Department Diversity
By Race and Gender
Native
Black or American Some Other or
Hispanic or Hawaiian and
White African Asian Indian and Two or More Female Male
Latino Other Pac.
American Alaska Native Races
Islander
City of Arlington Population 38.6% 29.6% 22.3% 6.5% 0.3% 0.2% 2.6% 50.8% 49.2%
City Organization 55.8% 20.1% 16.9% 3.5% 0.7% 0.2% 2.7% 38.7% 61.3%
Parks and Recreation 58.0% 19.1% 16.6% 3.3% 0.5% 0.4% 2.1% 47.9% 52.1%
* Includes General Fund and Park Performance Fund Employees
City‐wide Budget Impacts
FY 2022 expenditures are impacted by a 3% across-the-board compensation adjustment effective October 2021 and a 5.4%
increase in the city’s contribution to employee health coverage.
FY 2022 Adopted Budget and Business Plan 226 City of Arlington, Texas