
Page 82 - Watauga FY21 Budget
P. 82
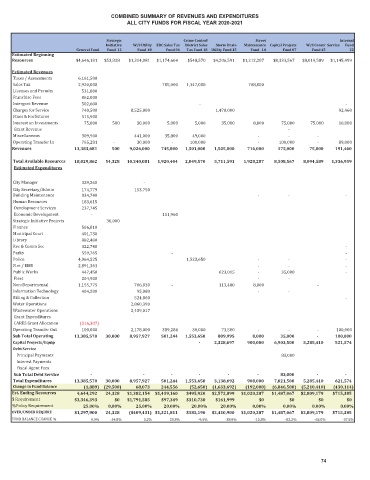
COMBINED SUMMARY OF REVENUES AND EXPENDITURES
                                           ALL CITY FUNDS FOR FISCAL YEAR 2020-2021


                                    Strategic                 Crime Control           Street                     Internal
                                    Initiative   W/S Utility   EDC Sales Tax   District Sales   Storm Drain   Maintenance  Capital Projects   W/S Constr  Service       Fund
                          General Fund  Fund  13  Fund  40  Fund 04  Tax Fund 18  Utility Fund 15  Fund   14  Fund 07  Fund 45  22
     Estimated Beginning
     Resources            $4,646,181  $53,828  $1,314,081  $1,174,604  $548,570  $4,206,591  $1,212,287  $8,333,567  $8,019,589  $1,145,499
     Estimated Revenues
      Taxes / Assessments           6,161,500
      Sales Tax                  2,920,000                   705,000       1,347,000             708,000
      Licenses and Permits               531,000
      Franchise Fees                 862,000
      Intergovt Revenue               502,600                      -                                               -
      Charges for Service               740,500          8,525,000            1,470,000                                   92,460
      Fines & Forfeitures               515,900
      Interest on Investments                 75,000              500                30,000                5,000                5,000               35,000                  8,000                75,000               75,000              10,000
       Grant Revenue                                                                            -
      Miscellaneous                  309,900              441,000              35,800             49,000  -    -    -


      Operating Transfer In               765,281  -      30,000  -    100,000        -      100,000      -        89,000
     Revenues                13,383,681  500        9,026,000          745,800      1,501,000       1,505,000           716,000    175,000              75,000    191,460
      Total Available Resources       18,029,862       54,328      10,340,081      1,920,404      2,049,570       5,711,591       1,928,287         8,508,567       8,094,589      1,336,959
      Estimated Expenditures

      City Manager                   329,260     -
      City Secretary/Admin               174,779              153,750
      Building Maintenance               834,740                                      -         -                  -
      Human Resources                183,615
       Development Services               237,745
       Economic Development    -                             111,960
      Strategic Initiative Projects         30,000
      Finance                        506,810
      Municipal Court                401,730
      Library                        882,480
      Rec & Comm Svc                 322,740                                                                       -
      Parks                          559,765              -                                                        -
      Police                     4,064,525                         1,523,650          -         -                  -
      Fire / EMS                 2,891,363                                            -         -                  -
      Public Works                   447,450                                     623,015  -    35,000              -
       Fleet                         204,900                                          -         -
      Non-Departmental           1,155,775              706,830  -               113,480                  8,000  -
      Information Technology               404,200                95,080              -         -
      Billing & Collection                            524,860                                                      -
      Water Operations                            2,860,390
      Wastewater Operations                       2,439,017
       Grant Expenditures
       CARES Grant Allocation             (316,307)
      Operating Transfer Out               100,000  -      2,178,000           389,284             30,000               73,500  -    -    -           100,000
      Sub Total Operating       13,385,570       30,000  8,957,927          501,244      1,553,650           809,995                 8,000               35,000  -      100,000
      Capital Projects/Equip                                       -      2,328,697           900,000         6,903,500       5,285,410    521,574
      Debt Service
          Principal Payments                                                                            83,000
          Interest Payments
          Fiscal Agent Fees
      Sub Total Debt Service   -                -                      -                    -    -  -                 83,000    -                     -
      Total Expenditures       13,385,570       30,000        8,957,927          501,244      1,553,650       3,138,692           908,000         7,021,500       5,285,410          621,574
      Change in Fund Balance                 (1,889)    (29,500)              68,073          244,556          (52,650)    (1,633,692)        (192,000)      (6,846,500)    (5,210,410)       (430,114)
     Est. Ending Resources        4,644,292       24,328  $1,382,154  $1,419,160  $495,920  $2,572,899  $1,020,287  $1,487,067  $2,809,179  $715,385
     $ Requirement        $3,346,393   $0  $1,791,585  $97,349  $310,730  $161,999     $0        $0       $0        $0
     %Policy Requirement     25.00%  0.00%    25.00%   20.00%   20.00%    20.00%     0.00%     0.00%    0.00%     0.00%
     OVER/UNDER REQUIRE   $1,297,900       24,328  ($409,431) $1,321,811  $185,190  $2,410,900  $1,020,287  $1,487,067  $2,809,179  $715,385
     FUND BALANCE CHANGE %     0.0%   -54.8%     5.2%    20.8%     -9.6%    -38.8%   -15.8%    -82.2%    -65.0%   -37.5%


                                                                                                           74