
Page 204 - Watauga FY21 Budget
P. 204
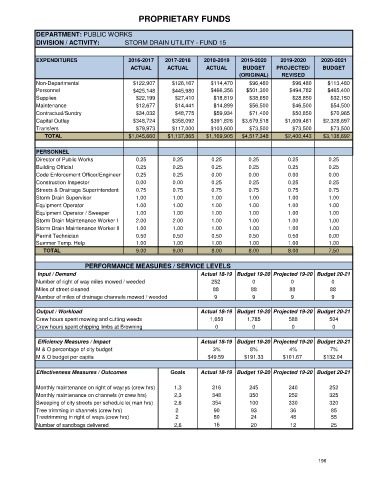
PROPRIETARY FUNDS


           DEPARTMENT: PUBLIC WORKS
           DIVISION / ACTIVITY:         STORM DRAIN UTILITY - FUND 15


           EXPENDITURES                  2016-2017   2017-2018    2018-2019   2019-2020    2019-2020     2020-2021
                                          ACTUAL      ACTUAL       ACTUAL      BUDGET     PROJECTED/     BUDGET
                                                                              (ORIGINAL)    REVISED
           Non-Departmental                $122,907     $126,167    $114,470     $96,480       $96,480     $113,480
           Personnel                       $425,148     $445,980    $466,356    $501,300      $494,782     $465,400
           Supplies                         $22,199      $27,410     $18,819     $38,650       $28,850      $32,150
           Maintenance                      $12,677      $14,441     $14,899     $56,500       $46,500      $54,500
           Contractual/Sundry               $34,032      $48,775     $59,934     $71,400       $50,850      $70,965
           Capital Outlay                  $348,724     $358,092    $391,826   $3,679,518    $1,609,481   $2,328,697
           Transfers                        $79,973     $117,000    $103,600     $73,500       $73,500      $73,500
                 TOTAL                   $1,045,660   $1,137,865   $1,169,905  $4,517,348    $2,400,443   $3,138,692

           PERSONNEL
           Director of Public Works         0.25        0.25         0.25        0.25         0.25         0.25
           Building Official                0.25        0.25         0.25        0.25         0.25         0.25
           Code Enforcement Officer/Engineer  0.25      0.25         0.00        0.00         0.00         0.00
           Construction Inspector           0.00        0.00         0.25        0.25         0.25         0.25
           Streets & Drainage Superintendent  0.75      0.75         0.75        0.75         0.75         0.75
           Storm Drain Supervisor           1.00        1.00         1.00        1.00         1.00         1.00
           Equipment Operator               1.00        1.00         1.00        1.00         1.00         1.00
           Equipment Operator / Sweeper     1.00        1.00         1.00        1.00         1.00         1.00
           Storm Drain Maintenance Worker I  2.00       2.00         1.00        1.00         1.00         1.00
           Storm Drain Maintenance Worker II   1.00     1.00         1.00        1.00         1.00         1.00
           Permit Technician                0.50        0.50         0.50        0.50         0.50         0.00
           Summer Temp. Help                1.00        1.00         1.00        1.00         1.00         1.00
                TOTAL                       9.00        9.00         8.00        8.00         8.00         7.50

                                       PERFORMANCE MEASURES / SERVICE LEVELS
            Input / Demand                                       Actual 18-19 Budget 19-20 Projected 19-20 Budget 20-21
           Number of right of way miles mowed / weeded               252          0            0            0
           Miles of street cleaned                                   88           88          88            88
           Number of miles of drainage channels mowed / weeded        9           9            9            9

           Output / Workload                                     Actual 18-19 Budget 19-20 Projected 19-20 Budget 20-21
           Crew hours spent mowing and cutting weeds                1,650       1,785         588           504
           Crew hours spent chipping limbs at Browning                0           0            0             0

            Efficiency Measures / Impact                         Actual 18-19 Budget 19-20 Projected 19-20 Budget 20-21
           M & O percentage of city budget                           3%          8%           4%            7%
           M & O budget per capita                                 $49.59      $191.33      $101.67       $132.04

           Effectiveness Measures / Outcomes           Goals     Actual 18-19 Budget 19-20 Projected 19-20 Budget 20-21


           Monthly maintenance on right of waysys (crew hrs)  1,3    216         245          240           252


           Monthly maintenance on channels (mcrew hrs)  2,3          348         350          252           325

           Sweeping of city streets per schedulele( man hrs)  2,6    354         100          330           320
           Tree trimming in channels (crew hrs)          2           90           93           36           85
           Treetrimming in right of ways.(crew hrs)      2           80           24           48           55
           Number of sandbags delivered                 2,6          16           20           12           25


                                                                                                        196