
Page 287 - N. Richland Hills General Budget
P. 287
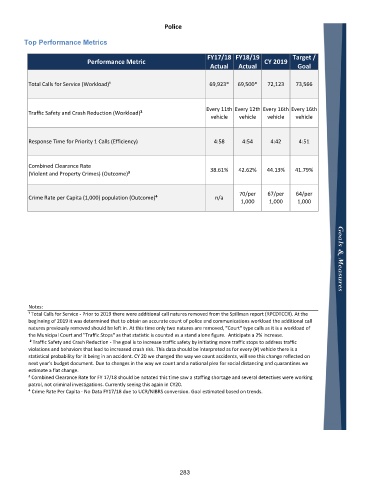
Police

         Top Performance Metrics

                                                                      FY17/18  FY18/19            Target /
                              Performance Metric                                        CY 2019
                                                                       Actual   Actual             Goal


          Total Calls for Service (Workload)¹                         69,923*   69,500*   72,123   73,566


                                                                     Every 11th  Every 12th  Every 16th   Every 16th
          Traffic Safety and Crash Reduction (Workload)²
                                                                       vehicle  vehicle  vehicle   vehicle


          Response Time for Priority 1 Calls (Efficiency)               4:58     4:54      4:42     4:51


          Combined Clearance Rate
                                                                       38.61%   42.62%   44.13%    41.79%
          (Violent and Property Crimes) (Outcome)³

                                                                                70/per    67/per   64/per
          Crime Rate per Capita (1,000) population (Outcome)⁴           n/a
                                                                                 1,000    1,000    1,000


          Notes:
          ¹ Total Calls for Service ‐ Prior to 2019 there were additional call natures removed from the Spillman report (RPCDTCCR). At the
          beginning of 2019 it was determined that to obtain an accurate count of police and communications workload the additional call
          natures previously removed should be left in. At this time only two natures are removed, "Court" type calls as it is a workload of
          the Municipal Court and "Traffic Stops" as that statistic is counted as a stand alone figure.  Anticipate a 2% increase.
           ² Traffic Safety and Crash Reduction ‐ The goal is to increase traffic safety by initiating more traffic stops to address traffic
          violations and behaviors that lead to increased crash risk. This data should be interpreted as for every (#) vehicle there is a
          statistical probability for it being in an accident. CY 20 we changed the way we count accidents, will see this change reflected on
          next year's budget document. Due to changes in the way we count and a national plea for social distancing and quarantines we
          estimate a flat change.
          ³ Combined Clearance Rate for FY 17/18 should be notated this time saw a staffing shortage and several detectives were working
          patrol, not criminal investigations. Currently seeing this again in CY20.
          ⁴ Crime Rate Per Capita ‐ No Data FY17/18 due to UCR/NIBRS conversion. Goal estimated based on trends.


                                                             283