
Page 168 - Keller Budget FY21
P. 168
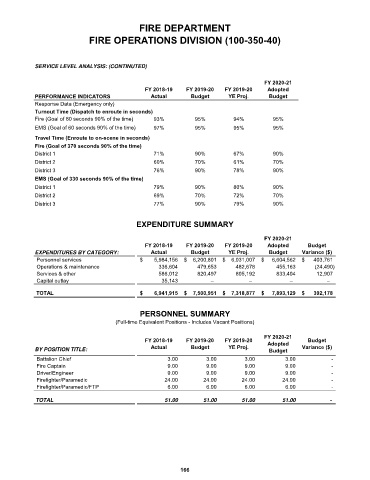
FIRE DEPARTMENT
                               FIRE OPERATIONS DIVISION (100-350-40)


             SERVICE LEVEL ANALYSIS: (CONTINUTED)

                                                                                        FY 2020-21
                                                 FY 2018-19    FY 2019-20   FY 2019-20    Adopted
             PERFORMANCE INDICATORS                Actual       Budget       YE Proj.     Budget
             Response Data (Emergency only)
             Turnout Time (Dispatch to enroute in seconds)
             Fire (Goal of 80 seconds 90% of the time)  93%       95%         94%          95%
             EMS (Goal of 60 seconds 90% of the time)  97%        95%         95%          95%
             Travel Time (Enroute to on-scene in seconds)
             Fire (Goal of 370 seconds 90% of the time)
             District 1                             71%           90%         67%          90%
             District 2                             60%           70%         61%          70%
             District 3                             76%           90%         78%          90%
             EMS (Goal of 330 seconds 90% of the time)
             District 1                             79%           90%         80%          90%
             District 2                             69%           70%         72%          70%
             District 3                             77%           90%         79%          90%


                                              EXPENDITURE SUMMARY


                                                                                        FY 2020-21
                                                 FY 2018-19    FY 2019-20   FY 2019-20    Adopted      Budget
             EXPENDITURES BY CATEGORY:             Actual       Budget       YE Proj.     Budget     Variance ($)
             Personnel services                $          5,984,156  $      6,200,801  $      6,031,007  $       6,604,562  $        403,761
             Operations & maintenance                         336,604             479,653             482,678              455,163             (24,490)
             Services & other                                 586,012             820,497             805,192              833,404              12,907
             Capital outlay                                     35,143                      –                      –                        –                     –

             TOTAL                             $         6,941,915  $     7,500,951  $     7,318,877  $       7,893,129  $       392,178


                                               PERSONNEL SUMMARY
                                       (Full-time Equivalent Positions - Includes Vacant Positions)

                                                                                        FY 2020-21
                                                 FY 2018-19    FY 2019-20   FY 2019-20    Adopted      Budget
             BY POSITION TITLE:                    Actual       Budget       YE Proj.     Budget     Variance ($)
             Battalion Chief                                        3.00                   3.00                   3.00                     3.00                       -
             Fire Captain                                           9.00                   9.00                   9.00                     9.00                       -
             Driver/Engineer                                        9.00                   9.00                   9.00                     9.00                       -
             Firefighter/Paramedic                                24.00                 24.00                 24.00                   24.00                       -
             Firefighter/Paramedic/FTP                              6.00                   6.00                   6.00                     6.00                       -

             TOTAL                                               51.00                 51.00                51.00                  51.00                      -


                                                             166