Page 220 - Hurst Budget FY21
P. 220

ENTERPRISE FUND

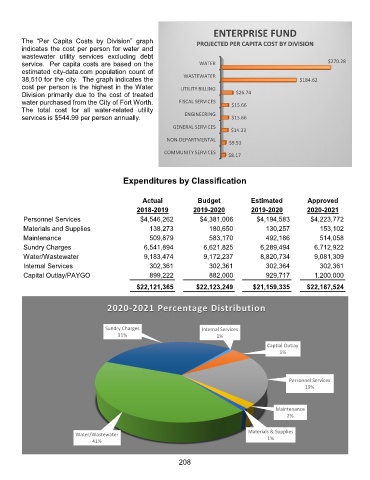
        The  “Per  Capita  Costs  by  Division”  graph            PROJECTED PER CAPITA COST BY DIVISION
        indicates the cost per person for water and
        wastewater utility services excluding debt
        service.  Per capita costs are based on the                WATER                                      $270.28
        estimated city-data.com population count of           WASTEWATER
        38,510 for the city.  The graph indicates the                                               $184.62
        cost per person is the highest in the Water          UTILITY BILLING
        Division primarily due to the cost of treated                          $26.74
        water purchased from the City of Fort Worth.        FISCAL SERVICES   $15.66
        The  total cost  for all water-related utility        ENGINEERING
        services is $544.99 per person annually.                              $15.66
                                                          GENERAL SERVICES
                                                                             $14.33
                                                        NON-DEPARTMENTAL
                                                                             $9.53
                                                       COMMUNITY SERVICES
                                                                             $8.17


                                          Expenditures by Classification


                                                Actual            Budget            Estimated          Approved
                                              2018-2019          2019-2020          2019-2020          2020-2021
         Personnel Services                    $4,546,262          $4,381,006         $4,194,583        $4,223,772
         Materials and Supplies                   138,273             180,650            130,257           153,102
         Maintenance                              509,879             583,170            492,186           514,058
         Sundry Charges                          6,541,894          6,621,825          6,289,494         6,712,922
         Water/Wastewater                        9,183,474          9,172,237          8,820,734         9,081,309
         Internal Services                        302,361             302,361            302,364           302,361
         Capital Outlay/PAYGO                     899,222             882,000            929,717         1,200,000
                                              $22,121,365         $22,123,249        $21,159,335       $22,187,524


                                     2020-2021 Percentage Distribution


                                    Sundry Charges                  Internal Services
                                        31%                              1%
                                                                                         Captial Outlay
                                                                                             5%


                                                                                                 Personnel Services
                                                                                                      19%


                                                                                            Maintenance
                                                                                                2%

                                                                                   Materials & Supplies
                          Water/Wastewater
                                41%                                                      1%


                                                            208
   215   216   217   218   219   220   221   222   223   224   225