
Page 219 - Hurst Budget FY21
P. 219
ENTERPRISE FUND ENTERPRISE FUND
DISTRIBUTION OF REVENUES DISTRIBUTION OF
EXPENDITURES
Community
Penalities Misc. Services Non-Departmental General Services
Wastewater 2% 1% Debt 1% 2% 7%
36% Service Fiscal Services
6% 3%
Engineering
3%
Wholesale
38%
Water Ops.
Water 25%
61%
Wastewater Ops.
15%
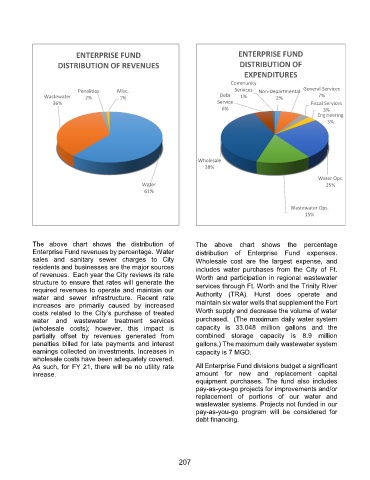
The above chart shows the distribution of The above chart shows the percentage
Enterprise Fund revenues by percentage. Water distribution of Enterprise Fund expenses.
sales and sanitary sewer charges to City Wholesale cost are the largest expense, and
residents and businesses are the major sources includes water purchases from the City of Ft.
of revenues. Each year the City reviews its rate Worth and participation in regional wastewater
structure to ensure that rates will generate the services through Ft. Worth and the Trinity River
required revenues to operate and maintain our
water and sewer infrastructure. Recent rate Authority (TRA). Hurst does operate and
increases are primarily caused by increased maintain six water wells that supplement the Fort
costs related to the City’s purchase of treated Worth supply and decrease the volume of water
water and wastewater treatment services purchased. (The maximum daily water system
(wholesale costs); however, this impact is capacity is 33.048 million gallons and the
partially offset by revenues generated from combined storage capacity is 8.9 million
penalties billed for late payments and interest gallons.) The maximum daily wastewater system
earnings collected on investments. Increases in capacity is 7 MGD.
wholesale costs have been adequately covered.
As such, for FY 21, there will be no utility rate All Enterprise Fund divisions budget a significant
inrease. amount for new and replacement capital
equipment purchases. The fund also includes
pay-as-you-go projects for improvements and/or
replacement of portions of our water and
wastewater systems. Projects not funded in our
pay-as-you-go program will be considered for
debt financing.
207