Page 56 - Grapevine Budget FY21
P. 56

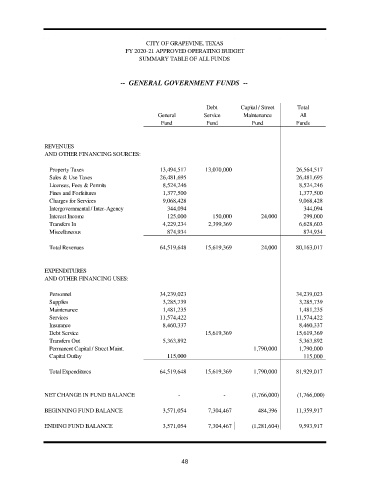
CITY OF GRAPEVINE, TEXAS
                                           FY 2020-21 APPROVED OPERATING BUDGET
                                               SUMMARY TABLE OF ALL FUNDS


                                         --  GENERAL GOVERNMENT FUNDS  --


                                                                     Debt        Capital / Street  Total
                                                     General        Service       Maintenance       All
                                                      Fund           Fund           Fund           Funds


                REVENUES
                AND OTHER FINANCING SOURCES:

                 Property Taxes                       13,494,517     13,070,000                    26,564,517
                 Sales & Use Taxes                    26,481,695                                   26,481,695
                 Licenses, Fees & Permits              8,524,246                                    8,524,246
                 Fines and Forfeitures                 1,377,500                                    1,377,500
                 Charges for Services                  9,068,428                                    9,068,428
                 Intergovernmental / Inter-Agency       344,094                                      344,094
                 Interest Income                        125,000        150,000         24,000        299,000
                 Transfers In                          4,229,234      2,399,369                     6,628,603
                 Miscellaneous                          874,934                                      874,934

                 Total Revenues                       64,519,648     15,619,369        24,000      80,163,017


                EXPENDITURES
                AND OTHER FINANCING USES:

                 Personnel                            34,239,023                                   34,239,023
                 Supplies                              3,285,739                                    3,285,739
                 Maintenance                           1,481,235                                    1,481,235
                 Services                             11,574,422                                   11,574,422
                 Insurance                             8,460,337                                    8,460,337
                 Debt Service                                        15,619,369                    15,619,369
                 Transfers Out                         5,363,892                                    5,363,892
                 Permanent Capital / Street Maint.                                   1,790,000      1,790,000
                 Capital Outlay                         115,000                                      115,000


                 Total Expenditures                   64,519,648     15,619,369      1,790,000     81,929,017


                NET CHANGE IN FUND BALANCE                              -                         -             (1,766,000)            (1,766,000)

                BEGINNING FUND BALANCE                 3,571,054      7,304,467       484,396      11,359,917

                ENDING FUND BALANCE                    3,571,054      7,304,467            (1,281,604)  9,593,917


                                                             48
   51   52   53   54   55   56   57   58   59   60   61