
Page 55 - Grapevine Budget FY21
P. 55
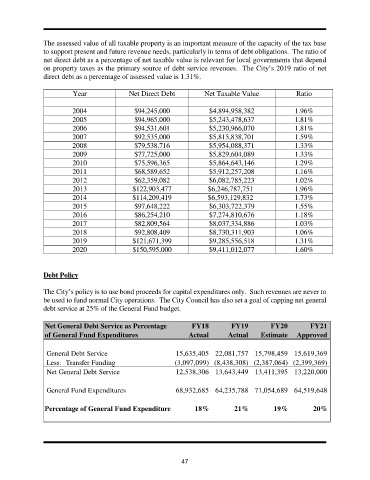
The assessed value of all taxable property is an important measure of the capacity of the tax base
               to support present and future revenue needs, particularly in terms of debt obligations.  The ratio of
               net direct debt as a percentage of net taxable value is relevant for local governments that depend
               on property taxes as the primary source of debt service revenues.  The City’s 2019 ratio of net
               direct debt as a percentage of assessed value is 1.31%.

                         Year               Net Direct Debt          Net Taxable Value             Ratio

                         2004                $94,245,000              $4,894,958,382               1.96%
                         2005                $94,965,000              $5,243,478,637               1.81%
                         2006                $94,531,601              $5,230,966,070               1.81%
                         2007                $92,535,000              $5,815,838,701               1.59%
                         2008                $79,538,716              $5,954,088,371               1.33%
                         2009                $77,725,000              $5,829,604,089               1.33%
                         2010                $75,596,365              $5,864,643,146               1.29%
                         2011                $68,589,652              $5,912,257,208               1.16%
                         2012                $62,359,082              $6,082,785,223               1.02%
                         2013                $122,903,477                $6,246,787,751            1.96%
                         2014                $114,209,419                $6,593,129,832            1.73%
                         2015                $97,648,222              $6,303,722,379               1.55%
                         2016                $86,254,210              $7,274,810,676               1.18%
                         2017                $82,809,564              $8,037,334,886               1.03%
                         2018                $92,808,409              $8,730,311,903               1.06%
                         2019                $121,671,399             $9,285,556,518               1.31%
                         2020                $150,595,000             $9,411,012,077               1.60%


               Debt Policy

               The City’s policy is to use bond proceeds for capital expenditures only.  Such revenues are never to
               be used to fund normal City operations.  The City Council has also set a goal of capping net general
               debt service at 25% of the General Fund budget.

                Net General Debt Service as Percentage          FY18          FY19         FY20         FY21
                of General Fund Expenditures                   Actual       Actual     Estimate    Approved


                General Debt Service                       15,635,405 22,081,757 15,798,459 15,619,369
                Less: Transfer Funding                     (3,097,099) (8,438,308) (2,387,064) (2,399,369)
                Net General Debt Service                   12,538,306 13,643,449 13,411,395 13,220,000


                General Fund Expenditures                  68,932,685 64,235,788 71,054,689 64,519,648

                Percentage of General Fund Expenditure           18%           21%          19%          20%


                                                             47