
Page 80 - Colleyville FY21 Budget
P. 80
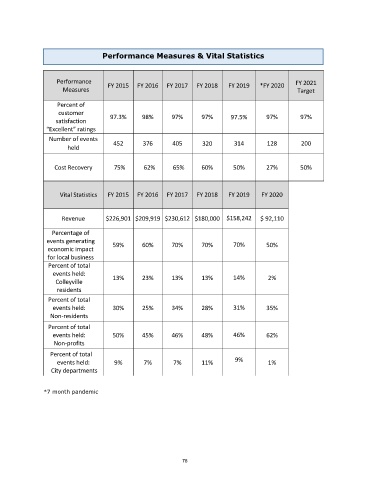
Performance Measures & Vital Statistics


                    Performance      FY 2015   FY 2016   FY 2017   FY 2018   FY 2019   *FY 2020    FY 2021
                      Measures                                                                     Target

                    Percent of
                    customer
                   satisfaction      97.3%      98%       97%       97%      97.5%       97%        97%
                “Excellent” ratings
                 Number of events
                                       452      376       405       320       314        128         200
                       held


                   Cost Recovery       75%       62%      65%       60%       50%        27%        50%


                     Vital Statistics   FY 2015   FY 2016   FY 2017   FY 2018   FY 2019   FY 2020


                     Revenue        $226,901  $209,919  $230,612  $180,000  $158,242   $ 92,110

                  Percentage of
                events generating     59%       60%       70%       70%       70%        50%
                 economic impact
                 for local business
                 Percent of total
                  events held:                                                14%
                   Colleyville        13%       23%       13%       13%                   2%
                    residents
                 Percent of total
                  events held:        30%       25%       34%       28%       31%        35%
                  Non-residents
                 Percent of total
                  events held:        50%       45%       46%       48%       46%        62%
                   Non-profits
                  Percent of total
                    events held:       9%        7%       7%        11%        9%         1%
                  City departments

               *7 month pandemic


                                                             78