
Page 57 - Colleyville FY21 Budget
P. 57
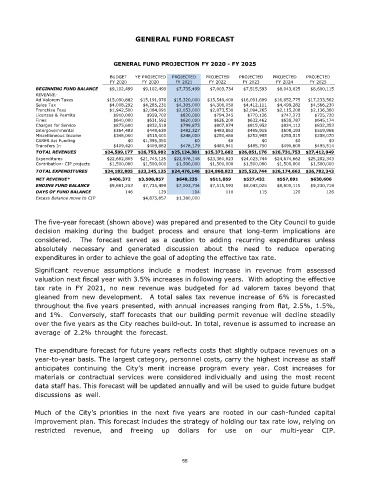
GENERAL FUND FORECAST


                                       GENERAL FUND PROJECTION FY 2020 - FY 2025

                                     BUDGET   YE PROJECTED  PROJECTED  PROJECTED  PROJECTED  PROJECTED  PROJECTED
                                     FY 2020    FY 2020    FY 2021    FY 2022    FY 2023    FY 2024     FY 2025
             BEGINNING FUND BALANCE  $9,102,499  $9,102,499  $7,735,499  $7,003,734  $7,515,593  $8,043,025  $8,600,115
             REVENUE:
             Ad Valorem Taxes       $15,090,882  $15,191,976  $15,320,000  $15,549,400  $16,091,609  $16,652,775  $17,233,562
             Sales Tax               $4,008,292  $4,285,231  $4,305,000  $4,306,050  $4,412,111  $4,499,282  $4,566,230
             Franchise Fees          $1,942,500  $2,084,091  $2,053,000  $2,073,530  $2,094,265  $2,115,208  $2,136,360
             Licenses & Permits        $910,000   $959,702   $820,000   $794,345   $770,126   $747,273   $725,720
             Fines                     $640,000   $631,592   $620,000   $626,200   $632,462   $638,787   $645,174
             Charges for Service       $875,600   $832,518   $799,875   $807,874   $815,952   $824,112   $832,353
             Intergovernmental         $364,483   $448,639   $482,327   $483,863   $495,915   $508,193   $519,965
             Miscellaneous Income      $348,000   $515,001   $248,000   $250,480   $252,985   $255,515   $258,070
             CARES Act Funding             $0   $1,395,350       $0          $0         $0         $0         $0
             Transfers In              $409,420   $409,882   $476,179   $480,941   $485,750   $490,608   $495,514
             TOTAL REVENUES         $24,589,177  $26,753,982  $25,124,381  $25,372,682  $26,051,176  $26,731,753  $27,412,949
             Expenditures           $22,682,805  $21,745,125  $22,976,146  $23,360,823  $24,023,744  $24,674,662  $25,282,343
             Contribution- CIP projects  $1,500,000  $1,500,000  $1,500,000  $1,500,000  $1,500,000  $1,500,000  $1,500,000
             TOTAL EXPENDITURES     $24,182,805  $23,245,125  $24,476,146  $24,860,823  $25,523,744  $26,174,662  $26,782,343
             NET REVENUE*            $406,372  $3,508,857  $648,235   $511,859    $527,432   $557,091   $630,606
             ENDING FUND BALANCE     $9,681,253  $7,735,499  $7,003,734  $7,515,593  $8,043,025  $8,600,115  $9,230,719
             DAYS OF FUND BALANCE         146        129         104        110        115        120        126
             Excess Balance move to CIP         $4,875,857  $1,380,000


             The five-year forecast (shown above) was prepared and presented to the City Council to guide
             decision  making  during  the  budget  process  and  ensure  that  long-term  implications  are
             considered.    The  forecast  served  as  a  caution  to  adding  recurring  expenditures  unless
             absolutely  necessary  and  generated  discussion  about  the  need  to  reduce  operating
             expenditures in order to achieve the goal of adopting the effective tax rate.

             Significant  revenue  assumptions  include  a  modest  increase  in  revenue  from  assessed
             valuation next fiscal year with 3.5% increases in following years.  With adopting the effective
             tax  rate  in  FY  2021,  no  new  revenue  was  budgeted  for  ad  valorem  taxes  beyond  that
             gleaned  from  new  development.    A  total  sales  tax  revenue  increase  of  6%  is  forecasted
             throughout the five years presented, with annual increases ranging from flat, 2.5%, 1.5%,
             and 1%.  Conversely, staff forecasts that our building permit revenue will decline steadily
             over the five years as the City reaches build-out. In total, revenue is assumed to increase an
             average  of  2.2%  throught  the  forecast.dddddddddddddddddddddddddddddddddddddddddd

             The expenditure forecast for future years reflects costs that slightly outpace revenues on a
             year-to-year basis. The largest category, personnel costs, carry the highest increase as staff
             anticipates  continuing  the  City’s  merit  increase  program  every  year.  Cost  increases  for
             materials  or  contractual  services  were  considered  individually  and  using  the  most  recent
             data staff has. This forecast will be updated annually and will be used to guide future budget
             discussions  as  well.ddddddddddddddddddddddddddddddddddddddddddddddddddddddddddd


             Much  of  the  City’s  priorities  in  the  next  five  years  are  rooted  in  our  cash-funded  capital
             improvement plan. This forecast includes the strategy of holding our tax rate low, relying on
             restricted  revenue,  and  freeing  up  dollars  for  use  on  our  multi-year  CIP.


                                                             55