Page 68 - Benbrook FY2021
P. 68

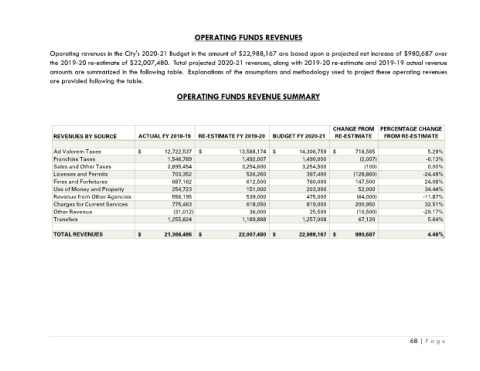
OPERATING FUNDS REVENUES

                 Operating revenues in the City's 2020-21 Budget in the amount of $22,988,167 are based upon a projected net increase of $980,687 over
                 the 2019-20 re-estimate of $22,007,480.  Total projected 2020-21 revenues, along with 2019-20 re-estimate and 2019-19 actual revenue
                 amounts are summarized in the following table.  Explanations of the assumptions and methodology used to project these operating revenues
                 are provided following the table.

                                                           OPERATING FUNDS REVENUE SUMMARY


                                                                                                               CHANGE FROM  PERCENTAGE CHANGE
                   REVENUES BY SOURCE          ACTUAL FY 2018-19  RE-ESTIMATE FY 2019-20   BUDGET FY 2020-21    RE-ESTIMATE     FROM RE-ESTIMATE

                   Ad Valorem Taxes            $                   12,722,537  $                             13,588,174  $                   14,306,759  $                718,585  5.29%
                   Franchise Taxes                                    1,546,789                                    1,492,007                          1,490,000                        (2,007)  -0.13%
                   Sales and Other Taxes                              2,895,454                                    3,254,600                          3,254,500                           (100)  0.00%
                   Licenses and Permits                                  703,352                                       526,260                             397,400                   (128,860)  -24.49%
                   Fines and Forfeitures                                 687,162                                       612,500                             760,000                    147,500  24.08%
                   Use of Money and Property                             254,723                                       151,000                             203,000                       52,000  34.44%
                   Revenue from Other Agencies                             556,195                                       539,000                             475,000                     (64,000)  -11.87%
                   Charges for Current Services                             775,463                                       618,050                             819,000                    200,950  32.51%
                   Other Revenue                                          (31,012)                                        36,000                               25,500                     (10,500)  -29.17%
                   Transfers                                          1,255,824                                    1,189,888                          1,257,008                       67,120  5.64%


                   TOTAL REVENUES              $                   21,366,486  $                             22,007,480  $                   22,988,167  $                980,687  4.46%


                                                                                                                                        68 | P a g e
   63   64   65   66   67   68   69   70   71   72   73