
Page 420 - City of Bedford FY21 Budget
P. 420
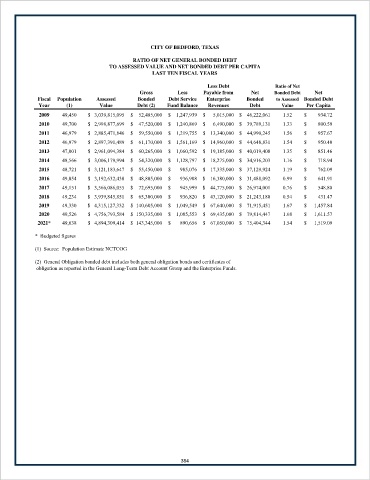
CITY OF BEDFORD, TEXAS
                                           RATIO OF NET GENERAL BONDED DEBT
                                   TO ASSESSED VALUE AND NET BONDED DEBT PER CAPITA
                                                 LAST TEN FISCAL YEARS

                                                                   Less Debt              Ratio of Net
                                             Gross       Less     Payable from    Net    Bonded Debt   Net
           Fiscal  Population  Assessed     Bonded    Debt Service  Enterprise  Bonded    to Assessed Bonded Debt
           Year      (1)        Value       Debt (2)  Fund Balance  Revenues     Debt       Value   Per Capita
            2009   49,450   $     3,039,815,095  $      52,485,000  $      1,247,939  $        5,015,000  $     46,222,061  1.52  $          934.72
            2010   49,700   $     2,998,877,699  $      47,520,000  $      1,240,869  $        6,490,000  $     39,789,131  1.33  $          800.59
            2011   46,979   $     2,885,471,846  $      59,550,000  $      1,219,755  $      13,340,000  $     44,990,245  1.56  $          957.67
            2012   46,979   $     2,897,391,489  $      61,170,000  $      1,561,169  $      14,960,000  $     44,648,831  1.54  $          950.40
            2013   47,001   $     2,961,094,384  $      60,265,000  $      1,060,592  $      19,185,000  $     40,019,408  1.35  $          851.46
            2014   48,566   $     3,006,179,994  $      54,320,000  $      1,128,797  $      18,275,000  $     34,916,203  1.16  $          718.94
            2015   48,721   $     3,121,183,647  $      55,450,000  $         985,076  $      17,335,000  $     37,129,924  1.19  $          762.09
            2016   49,054   $     3,192,632,438  $      48,805,000  $         936,908  $      16,380,000  $     31,488,092  0.99  $          641.91
            2017   49,151   $     3,566,086,055  $      72,695,000  $         945,999  $      44,775,000  $     26,974,001  0.76  $          548.80
            2018   49,234   $     3,939,845,851  $      65,300,000  $         936,820  $      43,120,000  $     21,243,180  0.54  $          431.47
            2019   49,330   $     4,315,127,332  $    140,605,000  $      1,049,549  $      67,640,000  $     71,915,451  1.67  $       1,457.84
            2020   49,526   $     4,756,793,584  $    150,335,000  $      1,085,553  $      69,435,000  $     79,814,447  1.68  $       1,611.57
           2021*   49,638   $     4,894,309,414  $    143,345,000  $         890,656  $      67,050,000  $     75,404,344  1.54  $       1,519.09
          *  Budgeted figures

          (1)  Source:  Population Estimate NCTCOG

          (2)  General Obligation bonded debt includes both general obligation bonds and certificates of
           obligation as reported in the General Long-Term Debt Account Group and the Enterprise Funds.


                                                          384