
Page 337 - City of Bedford FY21 Budget
P. 337
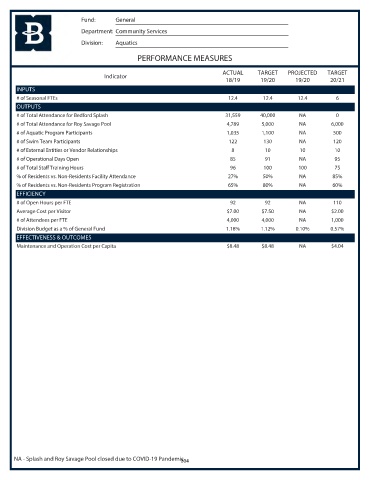
Fund:      General
                            Department: Community Services
                            Division:  Aquatics

                                               PERFORMANCE MEASURES

                                                                           ACTUAL     TARGET    PROJECTED    TARGET
                                    Indicator
                                                                            18/19      19/20       19/20      20/21
       INPUTS
       # of Seasonal FTEs                                                    12.4       12.4        12.4        6
       OUTPUTS
       # of Total Attendance for Bedford Splash                             31,559     40,000       NA          0
       # of Total Attendance for Roy Savage Pool                            4,789       5,000       NA         6,000
       # of Aquatic Program Participants                                    1,035       1,100       NA         500
       # of Swim Team Participants                                           122        130         NA         120
       # of External Entities or Vendor Relationships                         8          10         10          10
       # of Operational Days Open                                            85          91         NA          95
       # of Total Staff Training Hours                                       96         100         100         75
       % of Residents vs. Non-Residents Facility Attendance                 27%         50%         NA         85%
       % of Residents vs. Non-Residents Program Registration                65%         80%         NA         60%
       EFFICIENCY
       # of Open Hours per FTE                                               92          92         NA         110
       Average Cost per Visitor                                             $7.00       $7.50       NA         $2.00
       # of Attendees per FTE                                               4,000       4,000       NA         1,000
       Division Budget as a % of General Fund                               1.18%      1.12%       0.10%      0.57%
       EFFECTIVENESS & OUTCOMES
       Maintenance and Operation Cost per Capita                            $8.48       $8.48       NA         $4.04


      NA - Splash and Roy Savage Pool closed due to COVID-19 Pandemic
                                                             304