
Page 279 - City of Bedford FY21 Budget
P. 279
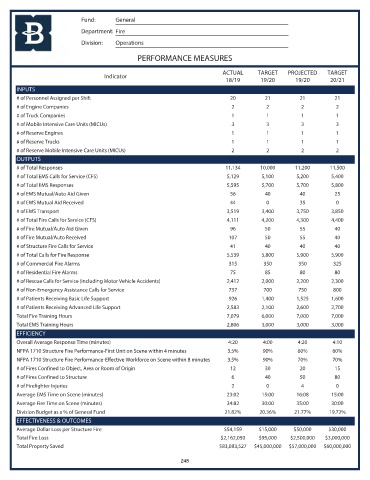
Fund:      General
                            Department: Fire
                            Division:  Operations

                                               PERFORMANCE MEASURES

                                                                           ACTUAL     TARGET    PROJECTED    TARGET
                                    Indicator
                                                                            18/19      19/20       19/20      20/21
       INPUTS
       # of Personnel Assigned per Shift                                     20          21         21          21
       # of Engine Companies                                                  2          2           2          2
       # of Truck Companies                                                   1          1           1          1
       # of Mobile Intensive Care Units (MICUs)                               3          3           3          3
       # of Reserve Engines                                                   1          1           1          1
       # of Reserve Trucks                                                    1          1           1          1
       # of Reserve Mobile Intensive Care Units (MICUs)                       2          2           2          2
       OUTPUTS
       # of Total Responses                                                 11,134     10,000      11,200     11,500
       # of Total EMS Calls for Service (CFS)                               5,129       5,100      5,200       5,400
       # of Total EMS Responses                                             5,595       5,700      5,700       5,800
       # of EMS Mutual/Auto Aid Given                                        56          40         40          25
       # of EMS Mutual Aid Received                                          44          0          35          0
       # of EMS Transport                                                   3,519       3,400      3,750       3,850
       # of Total Fire Calls for Service (CFS)                              4,111       4,200      4,300       4,400
       # of Fire Mutual/Auto Aid Given                                       96          50         55          40
       # of Fire Mutual/Auto Received                                        107         50         55          40
       # of Structure Fire Calls for Service                                 41          40         40          40
       # of Total Calls for Fire Response                                   5,539       5,800      5,900       5,900
       # of Commercial Fire Alarms                                           315        350         350        325
       # of Residential Fire Alarms                                          75          85         80          80
       # of Rescue Calls for Service (including Motor Vehicle Accidents)    2,412       2,000      2,200       2,300
       # of Non-Emergency Assistance Calls for Service                       737        700         750        800
       # of Patients Receiving Basic Life Support                            926        1,400      1,525       1,600
       # of Patients Receiving Advanced Life Support                        2,583       2,100      2,600       2,700
       Total Fire Training Hours                                            7,079       6,000      7,000       7,000
       Total EMS Training Hours                                             2,806       3,000      3,000       3,000
       EFFICIENCY
       Overall Average Response Time (minutes)                               4:20       4:00        4:20       4:10
       NFPA 1710 Structure Fire Performance-First Unit on Scene within 4 minutes  3.5%  90%         60%        60%
       NFPA 1710 Structure Fire Performance-Effective Workforce on Scene within 8 minutes  3.5%  90%  70%      70%
       # of Fires Confined to Object, Area or Room of Origin                 12          30         20          15
       # of Fires Confined to Structure                                       6          40         50          80
       # of Firefighter Injuries                                              2          0           4          0
       Average EMS Time on Scene (minutes)                                  23:02       15:00      16:08       15:00
       Average Fire Time on Scene (minutes)                                 34:82       30:00      35:00       30:00
       Division Budget as a % of General Fund                              21.82%      20.36%     21.77%      19.72%
       EFFECTIVENESS & OUTCOMES
       Average Dollar Loss per Structure Fire                              $54,159     $15,000    $50,000     $30,000
       Total Fire Loss                                                    $2,162,050   $95,000   $2,500,000  $3,000,000
       Total Property Saved                                               $83,083,527  $45,000,000  $57,000,000  $60,000,000
                                                             248