
Page 217 - FY 2009 Proposed Budget
P. 217
Special Revenue Funds
Contents
Table of Contents
of
Table
Table of Contents
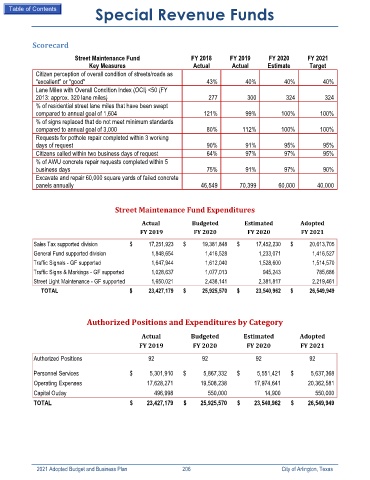
Scorecard
Street Maintenance Fund FY 2018 FY 2019 FY 2020 FY 2021
Key Measures Actual Actual Estimate Target
Citizen perception of overall condition of streets/roads as
"excellent" or "good" 43% 40% 40% 40%
Lane Miles with Overall Condition Index (OCI) <50 (FY
2013: approx. 320 lane miles) 277 300 324 324
% of residential street lane miles that have been swept
compared to annual goal of 1,604 121% 99% 100% 100%
% of signs replaced that do not meet minimum standards
compared to annual goal of 3,000 80% 112% 100% 100%
Requests for pothole repair completed within 3 working
days of request 90% 91% 95% 95%
Citizens called within two business days of request 64% 97% 97% 95%
% of AWU concrete repair requests completed within 5
business days 75% 91% 97% 90%
Excavate and repair 60,000 square yards of failed concrete
panels annually 46,549 70,399 60,000 40,000
Street Maintenance Fund Expenditures
Actual Budgeted Estimated Adopted
FY 2019 FY 2020 FY 2020 FY 2021
Sales Tax supported division $ 17,251,923 $ 19,381,848 $ 17,452,230 $ 20,613,705
General Fund supported division 1,848,654 1,416,528 1,233,071 1,416,527
Traffic Signals - GF supported 1,647,944 1,612,040 1,528,600 1,514,570
Traffic Signs & Markings - GF supported 1,028,637 1,077,013 945,243 785,686
Street Light Maintenance - GF supported 1,650,021 2,438,141 2,381,817 2,219,461
TOTAL $ 23,427,179 $ 25,925,570 $ 23,540,962 $ 26,549,949
Authorized Positions and Expenditures by Category
Actual Budgeted Estimated Adopted
FY 2019 FY 2020 FY 2020 FY 2021
Authorized Positions 92 92 92 92
Personnel Services $ 5,301,910 $ 5,867,332 $ 5,551,421 $ 5,637,368
Operating Expenses 17,628,271 19,508,238 17,974,641 20,362,581
Capital Outlay 496,998 550,000 14,900 550,000
TOTAL $ 23,427,179 $ 25,925,570 $ 23,540,962 $ 26,549,949
2021 Adopted Budget and Business Plan 206 City of Arlington, Texas