
Page 209 - FY 2009 Proposed Budget
P. 209
Special Revenue Funds
of
Contents
Table of Contents
Table
Table of Contents
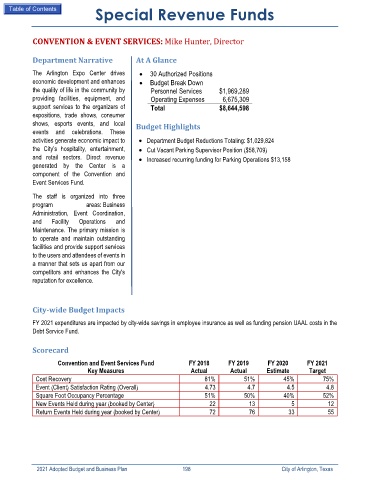
CONVENTION & EVENT SERVICES: Mike Hunter, Director
Department Narrative At A Glance
The Arlington Expo Center drives 30 Authorized Positions
economic development and enhances Budget Break Down
the quality of life in the community by Personnel Services $1,969,289
providing facilities, equipment, and Operating Expenses 6,675,309
support services to the organizers of Total $8,644,598
expositions, trade shows, consumer
shows, esports events, and local Budget Highlights
events and celebrations. These
activities generate economic impact to Department Budget Reductions Totaling: $1,029,824
the City’s hospitality, entertainment, Cut Vacant Parking Supervisor Position ($58,709)
and retail sectors. Direct revenue Increased recurring funding for Parking Operations $13,158
generated by the Center is a
component of the Convention and
Event Services Fund.
The staff is organized into three
program areas: Business
Administration, Event Coordination,
and Facility Operations and
Maintenance. The primary mission is
to operate and maintain outstanding
facilities and provide support services
to the users and attendees of events in
a manner that sets us apart from our
competitors and enhances the City's
reputation for excellence.
City‐wide Budget Impacts
FY 2021 expenditures are impacted by city-wide savings in employee insurance as well as funding pension UAAL costs in the
Debt Service Fund.
Scorecard
Convention and Event Services Fund FY 2018 FY 2019 FY 2020 FY 2021
Key Measures Actual Actual Estimate Target
Cost Recovery 81% 51% 45% 75%
Event (Client) Satisfaction Rating (Overall) 4.73 4.7 4.5 4.8
Square Foot Occupancy Percentage 51% 50% 40% 52%
New Events Held during year (booked by Center) 22 13 5 12
Return Events Held during year (booked by Center) 72 76 33 55
2021 Adopted Budget and Business Plan 198 City of Arlington, Texas