
Page 184 - FY 2009 Proposed Budget
P. 184
General Fund
of
Contents
Table of Contents
Table
Table of Contents
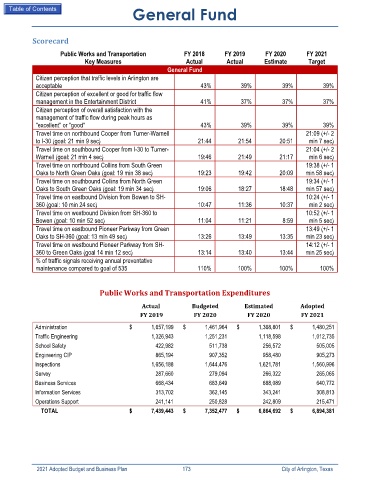
Scorecard
Public Works and Transportation FY 2018 FY 2019 FY 2020 FY 2021
Key Measures Actual Actual Estimate Target
General Fund
Citizen perception that traffic levels in Arlington are
acceptable 43% 39% 39% 39%
Citizen perception of excellent or good for traffic flow
management in the Entertainment District 41% 37% 37% 37%
Citizen perception of overall satisfaction with the
management of traffic flow during peak hours as
"excellent" or "good" 43% 39% 39% 39%
Travel time on northbound Cooper from Turner-Warnell 21:09 (+/- 2
to I-30 (goal: 21 min 9 sec) 21:44 21:54 20:51 min 7 sec)
Travel time on southbound Cooper from I-30 to Turner- 21:04 (+/- 2
Warnell (goal: 21 min 4 sec) 19:46 21:49 21:17 min 6 sec)
Travel time on northbound Collins from South Green 19:38 (+/- 1
Oaks to North Green Oaks (goal: 19 min 38 sec) 19:23 19:42 20:09 min 58 sec)
Travel time on southbound Collins from North Green 19:34 (+/- 1
Oaks to South Green Oaks (goal: 19 min 34 sec) 19:06 18:27 18:48 min 57 sec)
Travel time on eastbound Division from Bowen to SH- 10:24 (+/- 1
360 (goal: 10 min 24 sec) 10:47 11:36 10:37 min 2 sec)
Travel time on westbound Division from SH-360 to 10:52 (+/- 1
Bowen (goal: 10 min 52 sec) 11:04 11:21 8:59 min 5 sec)
Travel time on eastbound Pioneer Parkway from Green 13:49 (+/- 1
Oaks to SH-360 (goal: 13 min 49 sec) 13:26 13:49 13:35 min 23 sec)
Travel time on westbound Pioneer Parkway from SH- 14:12 (+/- 1
360 to Green Oaks (goal 14 min 12 sec) 13:14 13:40 13:44 min 25 sec)
% of traffic signals receiving annual preventative
maintenance compared to goal of 535 110% 100% 100% 100%
Public Works and Transportation Expenditures
Actual Budgeted Estimated Adopted
FY 2019 FY 2020 FY 2020 FY 2021
Administration $ 1,657,199 $ 1,461,964 $ 1,368,801 $ 1,480,251
Traffic Engineering 1,326,943 1,251,231 1,118,598 1,012,735
School Safety 422,982 511,738 256,572 505,005
Engineering CIP 865,194 907,352 958,480 905,273
Inspections 1,656,188 1,644,476 1,621,781 1,560,996
Survey 287,660 279,094 266,322 265,065
Business Services 668,434 683,649 688,089 640,772
Information Services 313,702 362,145 343,241 308,813
Operations Support 241,141 250,828 242,809 215,471
TOTAL $ 7,439,443 $ 7,352,477 $ 6,864,692 $ 6,894,381
2021 Adopted Budget and Business Plan 173 City of Arlington, Texas