
Page 158 - FY 2009 Proposed Budget
P. 158
General Fund
of
Contents
Table of Contents
Table
Table of Contents
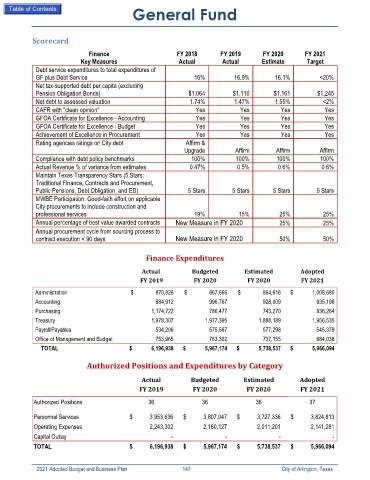
Scorecard
Finance FY 2018 FY 2019 FY 2020 FY 2021
Key Measures Actual Actual Estimate Target
Debt service expenditures to total expenditures of
GF plus Debt Service 16% 16.9% 16.1% <20%
Net tax-supported debt per capita (excluding
Pension Obligation Bonds) $1,064 $1,110 $1,161 $1,245
Net debt to assessed valuation 1.74% 1.47% 1.55% <2%
CAFR with "clean opinion" Yes Yes Yes Yes
GFOA Certificate for Excellence - Accounting Yes Yes Yes Yes
GFOA Certificate for Excellence - Budget Yes Yes Yes Yes
Achievement of Excellence in Procurement Yes Yes Yes Yes
Rating agencies ratings on City debt Affirm &
Upgrade Affirm Affirm Affirm
Compliance with debt policy benchmarks 100% 100% 100% 100%
Actual Revenue % of variance from estimates 0.47% 0.5% 0.6% 0.6%
Maintain Texas Transparency Stars (5 Stars:
Traditional Finance, Contracts and Procurement,
Public Pensions, Debt Obligation, and ED) 5 Stars 5 Stars 5 Stars 5 Stars
MWBE Participation: Good-faith effort on applicable
City procurements to include construction and
professional services 19% 15% 25% 25%
Annual percentage of best value awarded contracts New Measure in FY 2020 25% 25%
Annual procurement cycle from sourcing process to
contract execution < 90 days New Measure in FY 2020 50% 50%
Finance Expenditures
Actual Budgeted Estimated Adopted
FY 2019 FY 2020 FY 2020 FY 2021
Administration $ 870,826 $ 867,666 $ 864,616 $ 1,008,680
Accounting 884,912 996,767 928,009 935,198
Purchasing 1,174,722 786,477 743,270 836,264
Treasury 1,978,307 1,977,395 1,888,189 1,956,535
Payroll/Payables 534,206 575,567 577,298 545,379
Office of Management and Budget 753,965 763,302 737,155 684,038
TOTAL $ 6,196,938 $ 5,967,174 $ 5,738,537 $ 5,966,094
Authorized Positions and Expenditures by Category
Actual Budgeted Estimated Adopted
FY 2019 FY 2020 FY 2020 FY 2021
Authorized Positions 36 36 36 37
Personnel Services $ 3,953,636 $ 3,807,047 $ 3,727,336 $ 3,824,813
Operating Expenses 2,243,302 2,160,127 2,011,201 2,141,281
Capital Outlay - - - -
TOTAL $ 6,196,938 $ 5,967,174 $ 5,738,537 $ 5,966,094
2021 Adopted Budget and Business Plan 147 City of Arlington, Texas