
Page 55 - City of Westlake FY20 Budget
P. 55
Section 1 Executive
Community Profile
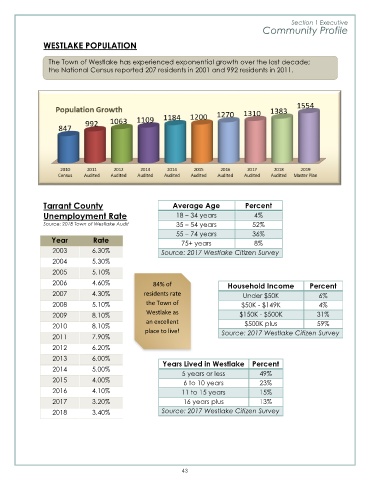
WESTLAKE POPULATION
The Town of Westlake has experienced exponential growth over the last decade;
the National Census reported 207 residents in 2001 and 992 residents in 2011.
Tarrant County Average Age Percent
Unemployment Rate 18 – 34 years 4%
Source: 2018 Town of Westlake Audit 35 – 54 years 52%
55 – 74 years 36%
Year Rate 75+ years 8%
2003 6.30% Source: 2017 Westlake Citizen Survey
2004 5.30%
2005 5.10%
2006 4.60% 84% of Household Income Percent
2007 4.30% residents rate Under $50K 6%
2008 5.10% the Town of $50K - $149K 4%
2009 8.10% Westlake as $150K - $500K 31%
an excellent
2010 8.10% place to live! $500K plus 59%
2011 7.90% Source: 2017 Westlake Citizen Survey
2012 6.20%
2013 6.00% Years Lived in Westlake Percent
2014 5.00% 5 years or less 49%
2015 4.00% 6 to 10 years 23%
2016 4.10% 11 to 15 years 15%
2017 3.20% 16 years plus 13%
2018 3.40% Source: 2017 Westlake Citizen Survey
43