Page 326 - City of Westlake FY20 Budget
P. 326

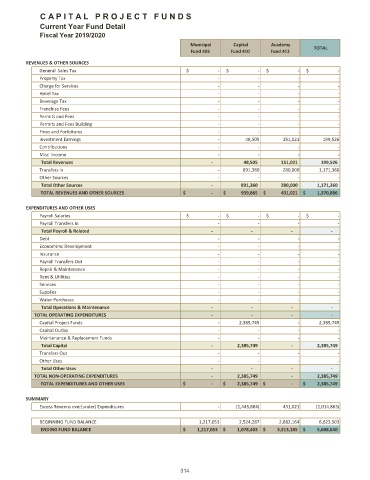
C A P I T A L   P R O J E C T   F U N D S

              Current Year Fund Detail
              Fiscal Year 2019/2020

                                                                 Municipal           Capital              Academy
                                                                                                          TOTAL
                                                                Fund 405     Fund 410      Fund 412
          REVENUES & OTHER SOURCES
              General  Sales Tax                               $                         ‐     $                         ‐     $                         ‐     $                         ‐
              Property Tax                                                                ‐                                ‐                                ‐                                ‐
              Charge for Services                                                         ‐                                ‐                                ‐                                ‐
              Hotel Tax                                                                   ‐                                ‐                                ‐                                ‐
              Beverage Tax                                                                ‐                                ‐                                ‐                                ‐
              Franchise Fees                                                              ‐                                ‐                                ‐                                ‐
              Permits and Fees                                                            ‐                                ‐                                ‐                                ‐
              Permits and Fees Building                                                   ‐                                ‐                                ‐                                ‐
              Fines and Forfeitures                                                       ‐                                ‐                                ‐                                ‐
              Investment Earnings                                                         ‐                       48,505                   151,021                   199,526
              Contributions                                                               ‐                                ‐                                ‐                                ‐
              Misc  Income                                                                ‐                                ‐                                ‐                                ‐
               Total Revenues                                                          ‐                      48,505                   151,021                   199,526
              Transfers In                                                                ‐                    891,360                   280,000                1,171,360
              Other Sources                                                               ‐                                ‐                                ‐                                ‐
               Total Other Sources                                                     ‐                    891,360                   280,000               1,171,360
               TOTAL REVENUES AND OTHER SOURCES               $                        ‐  $               939,865  $               431,021  $            1,370,886

          EXPENDITURES AND OTHER USES
              Payroll Salaries                                 $                         ‐     $                         ‐     $                         ‐     $                         ‐
              Payroll Transfers In                                                        ‐                                ‐                                ‐                                ‐
               Total Payroll & Related                                                 ‐                            ‐                            ‐                            ‐
              Debt                                                                          ‐                                ‐                                ‐                                ‐
              Economimc Development                                                         ‐                                ‐                                ‐                                ‐
              Insurance                                                                     ‐                                ‐                                ‐                                ‐
              Payroll Transfers Out                                                         ‐                                ‐                                ‐                                ‐
              Repair & Maintenance                                                          ‐                                ‐                                ‐                                ‐
              Rent & Utilities                                                              ‐                                ‐                                ‐                                ‐
              Services                                                                      ‐                                ‐                                ‐                                ‐
              Supplies                                                                      ‐                                ‐                                ‐                                ‐
              Water Purchases                                                               ‐                                ‐                                ‐                                ‐
               Total Operations & Maintenance                                          ‐                            ‐                            ‐                            ‐
            TOTAL OPERATING EXPENDITURES                                               ‐                            ‐                            ‐                            ‐
              Capital Project Funds                                                         ‐                2,385,749                                ‐                2,385,749
              Capital Outlay                                                                ‐                                ‐                                ‐                                ‐
              Maintenance & Replacement Funds                                               ‐                                ‐                                ‐                                ‐
               Total Capital                                                           ‐                2,385,749                           ‐                2,385,749
              Transfers Out                                                                 ‐                                ‐                                ‐                                ‐
              Other Uses                                                                    ‐                                ‐                                ‐                                ‐
               Total Other Uses                                                        ‐                            ‐                            ‐                            ‐
            TOTAL NON‐OPERATING EXPENDITURES                                           ‐                2,385,749                           ‐                2,385,749
               TOTAL EXPENDITURES AND OTHER USES              $                        ‐  $            2,385,749  $                        ‐  $            2,385,749

          SUMMARY
              Excess Revenus over(under) Expenditures                                       ‐              (1,445,884)                  431,021              (1,014,863)

              BEGINNING FUND BALANCE                                        1,217,053                2,524,287                2,882,164                6,623,503
               ENDING FUND BALANCE                            $            1,217,053  $            1,078,403  $            3,313,185  $            5,608,640


                                                             314
   321   322   323   324   325   326   327   328   329   330   331