
Page 325 - City of Westlake FY20 Budget
P. 325
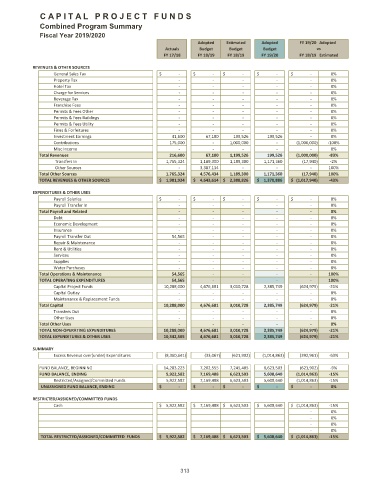
C A P I T A L P R O J E C T F U N D S
Combined Program Summary
Fiscal Year 2019/2020
Adopted Estimated Adopted FY 19/20 Adopted
Actuals Budget Budget Budget vs
FY 17/18 FY 18/19 FY 18/19 FY 19/20 FY 18/19 Estimated
REVENUES & OTHER SOURCES
1 General Sales Tax $ ‐ $ ‐ $ ‐ $ ‐ $ ‐ 0%
2 Property Tax ‐ ‐ ‐ ‐ ‐ 0%
3 Hotel Tax ‐ ‐ ‐ ‐ ‐ 0%
4 Charge for Services ‐ ‐ ‐ ‐ ‐ 0%
5 Beverage Tax ‐ ‐ ‐ ‐ ‐ 0%
6 Franchise Fees ‐ ‐ ‐ ‐ ‐ 0%
7 Permits & Fees Other ‐ ‐ ‐ ‐ ‐ 0%
8 Permits & Fees Buildings ‐ ‐ ‐ ‐ ‐ 0%
9 Permits & Fees Utility ‐ ‐ ‐ ‐ ‐ 0%
9 Fines & Forfeitures ‐ ‐ ‐ ‐ ‐ 0%
10 Investment Earnings 41,600 67,180 199,526 199,526 ‐ 0%
11 Contributions 175,000 ‐ 1,000,000 ‐ (1,000,000) ‐100%
12 Misc Income ‐ ‐ ‐ ‐ ‐ 0%
13 Total Revenues 216,600 67,180 1,199,526 199,526 (1,000,000) ‐83%
# Transfers In 1,765,324 1,189,300 1,189,300 1,171,360 (17,940) ‐2%
# Other Sources ‐ 3,387,134 ‐ ‐ ‐ 100%
16 Total Other Sources 1,765,324 4,576,434 1,189,300 1,171,360 (17,940) 100%
17 TOTAL REVENUES & OTHER SOURCES $ 1,981,924 $ 4,643,614 $ 2,388,826 $ 1,370,886 $ (1,017,940) ‐43%
EXPENDITURES & OTHER USES
18 Payroll Salaries $ ‐ $ ‐ $ ‐ $ ‐ $ ‐ 0%
19 Payroll Transfer In ‐ ‐ ‐ ‐ ‐ 0%
20 Total Payroll and Related ‐ ‐ ‐ ‐ ‐ 0%
21 Debt ‐ ‐ ‐ ‐ ‐ 0%
22 Economic Development ‐ ‐ ‐ ‐ ‐ 0%
23 Insurance ‐ ‐ ‐ ‐ ‐ 0%
24 Payroll Transfer Out 54,565 ‐ ‐ ‐ ‐ 0%
24 Repair & Maintenance ‐ ‐ ‐ ‐ ‐ 0%
25 Rent & Utilities ‐ ‐ ‐ ‐ ‐ 0%
26 Services ‐ ‐ ‐ ‐ ‐ 0%
27 Supplies ‐ ‐ ‐ ‐ ‐ 0%
28 Water Purchases ‐ ‐ ‐ ‐ ‐ 0%
29 Total Operations & Maintenance 54,565 ‐ ‐ ‐ ‐ 100%
30 TOTAL OPERATING EXPENDITURES 54,565 ‐ ‐ ‐ ‐ 100%
31 Capital Project Funds 10,288,000 4,676,681 3,010,728 2,385,749 (624,979) ‐21%
32 Capital Outlay ‐ ‐ ‐ ‐ ‐ 0%
33 Maintenance & Replacement Funds ‐ ‐ ‐ ‐ ‐ 0%
34 Total Capital 10,288,000 4,676,681 3,010,728 2,385,749 (624,979) ‐21%
35 Transfers Out ‐ ‐ ‐ ‐ ‐ 0%
36 Other Uses ‐ ‐ ‐ ‐ ‐ 0%
37 Total Other Uses ‐ ‐ ‐ ‐ ‐ 0%
38 TOTAL NON‐OPERATING EXPENDITURES 10,288,000 4,676,681 3,010,728 2,385,749 (624,979) ‐21%
39 TOTAL EXPENDITURES & OTHER USES 10,342,565 4,676,681 3,010,728 2,385,749 (624,979) ‐21%
SUMMARY
40 Excess Revenus over(under) Expenditures (8,360,641) (33,067) (621,902) (1,014,863) (392,961) ‐63%
41 FUND BALANCE, BEGINNING 14,283,223 7,202,555 7,245,405 6,623,503 (621,902) ‐9%
42 FUND BALANCE, ENDING 5,922,582 7,169,488 6,623,503 5,608,640 (1,014,863) ‐15%
43 Restricted/Assigned/Committed Funds 5,922,582 7,169,488 6,623,503 5,608,640 (1,014,863) ‐15%
44 UNASSIGNED FUND BALANCE, ENDING $ ‐ $ ‐ $ ‐ $ ‐ $ ‐ 0%
RESTRICTED/ASSIGNED/COMMITTED FUNDS
45 Cash $ 5,922,582 $ 7,169,488 $ 6,623,503 $ 5,608,640 $ (1,014,863) ‐15%
46 ‐ 0%
47 ‐ 0%
48 ‐ 0%
49 ‐ 0%
50 TOTAL RESTRICTED/ASSIGNED/COMMITTED FUNDS $ 5,922,582 $ 7,169,488 $ 6,623,503 $ 5,608,640 $ (1,014,863) ‐15%
313