Page 300 - City of Westlake FY20 Budget
P. 300

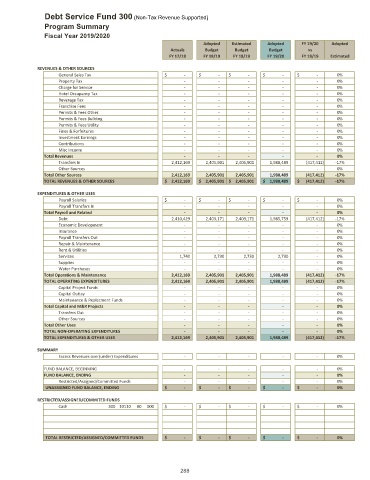
Debt Service Fund 300 (Non-Tax Revenue Supported)
                Program Summary
                Fiscal Year 2019/2020
                                                                    Adopted   Estimated   Adopted    FY 19/20  Adopted
                                                         Actuals     Budget    Budget     Budget       vs
                                                         FY 17/18   FY 18/19  FY 18/19    FY 19/20   FY 18/19  Estimated

             REVENUES & OTHER SOURCES
                    General Sales Tax                  $                    ‐  $                    ‐  $                    ‐  $                    ‐  $                  ‐    0%
                    Property Tax                                            ‐                       ‐                       ‐                       ‐                       ‐  0%
                    Charge for Service                                      ‐                       ‐                       ‐                       ‐                       ‐  0%
                    Hotel Occupancy Tax                                     ‐                       ‐                       ‐                       ‐                       ‐  0%
                    Beverage Tax                                            ‐                       ‐                       ‐                       ‐                       ‐  0%
                    Franchise Fees                                          ‐                       ‐                       ‐                       ‐                       ‐  0%
                    Permits & Fees Other                                    ‐                       ‐                       ‐                       ‐                       ‐  0%
                    Permits & Fees Building                                 ‐                       ‐                       ‐                       ‐                       ‐  0%
                    Permits & Fees Utility                                  ‐                       ‐                       ‐                       ‐                       ‐  0%
                    Fines & Forfeitures                                     ‐                       ‐                       ‐                       ‐                       ‐  0%
                    Investment Earnings                                     ‐                       ‐                       ‐                       ‐                       ‐  0%
                    Contributions                                           ‐                       ‐                       ‐                       ‐                       ‐  0%
                    Misc Income                                             ‐                       ‐                       ‐                       ‐                       ‐  0%
                Total Revenues                                               ‐                      ‐                        ‐                          ‐                        ‐  0%

                    Transfers In                               2,412,169          2,405,901         2,405,901          1,988,489            (417,412)  ‐17%
                    Other Sources                                           ‐                       ‐                       ‐                       ‐                       ‐  0%
                Total Other Sources                             2,412,169          2,405,901         2,405,901          1,988,489            (417,412)  ‐17%
                TOTAL REVENUES & OTHER SOURCES          $      2,412,169  $      2,405,901 $      2,405,901  $      1,988,489  $        (417,412)  ‐17%

             EXPENDITURES & OTHER USES
                    Payroll Salaries                   $                  ‐    $                    ‐  $                    ‐  $                  ‐    $                    ‐  0%
                    Payroll Transfers In                                    ‐                       ‐                       ‐                       ‐                       ‐  0%
                Total Payroll and Related                                    ‐                        ‐                      ‐                        ‐                          ‐  0%
                    Debt                                       2,410,429          2,403,171         2,403,171          1,985,759              (417,412)  ‐17%
                    Economic Development                                    ‐                       ‐                       ‐                       ‐                       ‐  0%
                    Insurance                                               ‐                       ‐                       ‐                       ‐                       ‐  0%
                    Payroll Transfers Out                                   ‐                       ‐                       ‐                       ‐                       ‐  0%
                    Repair & Maintenance                                    ‐                       ‐                       ‐                       ‐                       ‐  0%
                    Rent & Utilities                                        ‐                       ‐                       ‐                       ‐                       ‐  0%
                    Services                                           1,740                  2,730                 2,730                  2,730                       ‐  0%
                    Supplies                                                ‐                       ‐                       ‐                       ‐                       ‐  0%
                    Water Purchases                                         ‐                       ‐                       ‐                       ‐                       ‐  0%
                Total Operations & Maintenance                  2,412,169          2,405,901         2,405,901          1,988,489            (417,412)  ‐17%
                TOTAL OPERATING EXPENDITURES                    2,412,169          2,405,901         2,405,901          1,988,489            (417,412)  ‐17%
                    Capital Project Funds                                   ‐                       ‐                       ‐                       ‐                       ‐  0%
                    Capital Outlay                                          ‐                       ‐                       ‐                       ‐                       ‐  0%
                    Maintenance & Replacment Funds                          ‐                       ‐                       ‐                       ‐                       ‐  0%
                Total Capital and M&R Projects                               ‐                      ‐                          ‐                        ‐                        ‐  0%
                    Transfers Out                                           ‐                       ‐                       ‐                       ‐                       ‐  0%
                    Other Sources                                           ‐                       ‐                       ‐                       ‐                       ‐  0%
                Total Other Uses                                             ‐                        ‐                      ‐                          ‐                        ‐  0%
                TOTAL NON‐OPERATING EXPENDITURES                             ‐                        ‐                        ‐                      ‐                          ‐  0%
                TOTAL EXPENDITURES & OTHER USES                 2,412,169          2,405,901         2,405,901          1,988,489            (417,412)  ‐17%

             SUMMARY
                    Excess Revenues over(under) Expenditures                       ‐                       ‐                       ‐                       ‐                       ‐  0%
                FUND BALANCE, BEGINNING                                     ‐                       ‐                       ‐                       ‐                       ‐  0%
                FUND BALANCE, ENDING                                         ‐                        ‐                      ‐                          ‐                        ‐  0%
                    Restricted/Assigned/Committed Funds                       ‐                       ‐                       ‐                       ‐                       ‐  0%
                UNASSIGNED FUND BALANCE, ENDING         $                  ‐  $                  ‐  $                  ‐  $                  ‐  $                  ‐  0%
             RESTRICTED/ASSIGNED/COMMITED FUNDS
                    Cash             300 10110  00  000  $                  ‐    $                    ‐  $                    ‐  $                  ‐    $                    ‐  0%


                TOTAL RESTRICTED/ASSIGNED/COMMITTED FUNDS  $                  ‐  $                  ‐  $                  ‐  $                  ‐  $                  ‐  0%


                                                             288
   295   296   297   298   299   300   301   302   303   304   305