Page 244 - City of Westlake FY20 Budget
P. 244

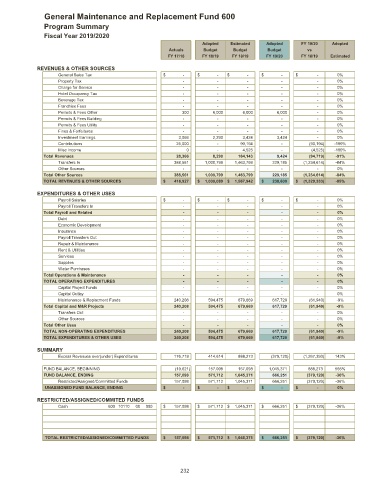
General Maintenance and Replacement Fund 600

                Program Summary
                Fiscal Year 2019/2020
                                                                    Adopted  Estimated   Adopted     FY 19/20  Adopted
                                                         Actuals    Budget    Budget      Budget       vs
                                                         FY 17/18   FY 18/19  FY 18/19   FY 19/20    FY 18/19  Estimated

             REVENUES & OTHER SOURCES
                    General Sales Tax                  $                 -  $                 -  $                 -  $                 -  $                  -  0%
                    Property Tax                                          -                     -                     -                     -                      -  0%
                    Charge for Service                                    -                     -                     -                     -                      -  0%
                    Hotel Occupancy Tax                                   -                     -                     -                     -                      -  0%
                    Beverage Tax                                          -                     -                     -                     -                      -  0%
                    Franchise Fees                                        -                     -                     -                     -                      -  0%
                    Permits & Fees Other                                 300                 6,000                 6,000                 6,000                      -  0%
                    Permits & Fees Building                               -                     -                     -                     -                      -  0%
                    Permits & Fees Utility                                -                     -                     -                     -                      -  0%
                    Fines & Forfeitures                                   -                     -                     -                     -                      -  0%
                    Investment Earnings                               3,066                 2,290                 3,424                 3,424                      -  0%
                    Contributions                                   25,000                     -               90,194                     -               (90,194)  -100%
                    Misc Income                                              0                     -                 4,525                     -                 (4,525)  -100%
               Total Revenues                                       28,366                 8,290             104,143                 9,424               (94,719)  -91%
                    Transfers In                                  388,561          1,000,799          1,463,799             229,185          (1,234,614)  -84%
                    Other Sources                                         -                     -                     -                     -                      -  0%
               Total Other Sources                                388,561          1,000,799          1,463,799             229,185          (1,234,614)  -84%
               TOTAL REVENUES & OTHER SOURCES          $         416,927  $      1,009,089  $      1,567,942  $         238,609  $      (1,329,333)  -85%
             EXPENDITURES & OTHER USES
                    Payroll Salaries                   $                 -  $                 -  $                 -  $                 -  $                  -  0%
                    Payroll Transfers In                                  -                     -                     -                     -                      -  0%
               Total Payroll and Related                                  -                     -                     -                     -                      -  0%
                    Debt                                                  -                     -                     -                     -                      -  0%
                    Economic Development                                  -                     -                     -                     -                      -  0%
                    Insurance                                             -                     -                     -                     -                      -  0%
                    Payroll Transfers Out                                 -                     -                     -                     -                      -  0%
                    Repair & Maintenance                                  -                     -                     -                     -                      -  0%
                    Rent & Utilities                                      -                     -                     -                     -                      -  0%
                    Services                                              -                     -                     -                     -                      -  0%
                    Supplies                                              -                     -                     -                     -                      -  0%
                    Water Purchases                                       -                     -                     -                     -                      -  0%
               Total Operations & Maintenance                             -                     -                     -                     -                      -  0%
               TOTAL OPERATING EXPENDITURES                               -                     -                     -                     -                      -  0%
                    Capital Project Funds                                 -                     -                     -                     -                      -  0%
                    Capital Outlay                                        -                     -                     -                     -                      -  0%
                    Maintenance & Replacment Funds                240,208             594,475             679,669             617,729               (61,940)  -9%
               Total Capital and M&R Projects                     240,208             594,475             679,669             617,729               (61,940)  -9%
                    Transfers Out                                         -                     -                     -                     -                      -  0%
                    Other Sources                                         -                     -                     -                     -                      -  0%
               Total Other Uses                                           -                     -                     -                     -                      -  0%
               TOTAL NON-OPERATING EXPENDITURES                   240,208             594,475             679,669             617,729               (61,940)  -9%
               TOTAL EXPENDITURES & OTHER USES                    240,208             594,475             679,669             617,729               (61,940)  -9%

             SUMMARY
                    Excess Revenues over(under) Expenditures             176,719             414,614             888,273            (379,120)          (1,267,393)  143%

               FUND BALANCE, BEGINNING                             (19,621)             157,098             157,098          1,045,371              888,273  565%
               FUND BALANCE, ENDING                               157,098             571,712          1,045,371             666,251             (379,120)  -36%
                    Restricted/Assigned/Committed Funds             157,098             571,712          1,045,371             666,251             (379,120)  -36%
                UNASSIGNED FUND BALANCE, ENDING        $                 -  $                 -  $                 -  $                 -  $                  -  0%
             RESTRICTED/ASSIGNED/COMMITED FUNDS
                    Cash             600 10110  00  000  $         157,098  $         571,712  $      1,045,371  $         666,251  $         (379,120)  -36%


                TOTAL RESTRICTED/ASSIGNED/COMMITTED FUNDS  $         157,098  $         571,712  $      1,045,371  $         666,251  $         (379,120)  -36%


                                                             232
   239   240   241   242   243   244   245   246   247   248   249