Page 120 - Keller FY20 Approved Budget
P. 120

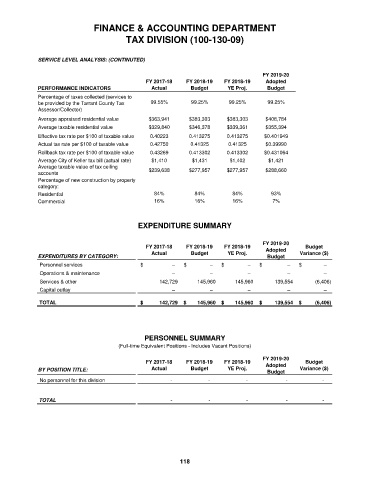
FINANCE & ACCOUNTING DEPARTMENT
                                           TAX DIVISION (100-130-09)


              SERVICE LEVEL ANALYSIS: (CONTINUTED)

                                                                                        FY 2019-20
                                                 FY 2017-18    FY 2018-19   FY 2018-19   Adopted
              PERFORMANCE INDICATORS               Actual       Budget      YE Proj.     Budget
              Percentage of taxes collected (services to
              be provided by the Tarrant County Tax   99.55%    99.25%       99.25%       99.25%
              Assessor/Collector)
              Average appraised residential value  $363,941     $383,303    $383,303     $408,784
              Average taxable residential value   $329,840      $346,378    $339,361     $355,394
              Effective tax rate per $100 of taxable value  0.40223  0.413275  0.413275  $0.401949
              Actual tax rate per $100 of taxable value  0.42750  0.41325    0.41325     $0.39990
              Rollback tax rate per $100 of taxable value  0.43269  0.413302  0.413302  $0.431064
              Average City of Keller tax bill (actual rate)  $1,410  $1,431  $1,402       $1,421
              Average taxable value of tax ceiling
              accounts                            $239,638      $277,957    $277,957     $288,660
              Percentage of new construction by property
              category:
              Residential                           84%          84%          84%          93%
              Commercial                            16%          16%          16%          7%


                                               EXPENDITURE SUMMARY


                                                                                        FY 2019-20
                                                 FY 2017-18    FY 2018-19   FY 2018-19                Budget
                                                   Actual       Budget      YE Proj.     Adopted    Variance ($)
              EXPENDITURES BY CATEGORY:                                                  Budget

              Personnel services                $                      –    $                   –  $                  –  $                    –  $                  –
              Operations & maintenance                                  –                         –                        –                        –                      –
              Services & other                                142,729               145,960               145,960               139,554                 (6,406)


              Capital outlay                                              –                       –                      –                        –                      –


              TOTAL                            $               142,729  $         145,960  $         145,960  $           139,554  $             (6,406)


                                                 PERSONNEL SUMMARY
                                        (Full-time Equivalent Positions - Includes Vacant Positions)
                                                                                        FY 2019-20
                                                 FY 2017-18    FY 2018-19   FY 2018-19   Adopted      Budget
              BY POSITION TITLE:                   Actual       Budget      YE Proj.     Budget     Variance ($)
              No personnel for this division                            -                      -                      -                       -                     -


              TOTAL                                                   -                     -                     -                       -                    -


                                                             118
   115   116   117   118   119   120   121   122   123   124   125