
Page 27 - Haltom City FY20 Approved Budget
P. 27
City of Haltom City Annual Budget, FY 2020
Overview
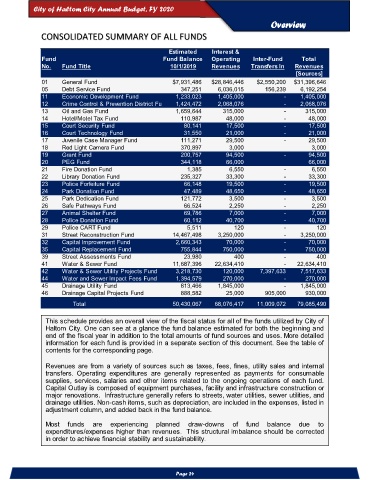
CONSOLIDATED SUMMARY OF ALL FUNDS
Estimated Interest &
Fund Fund Balance Operating Inter-Fund Total
No. Fund Title 10/1/2019 Revenues Transfers In Revenues
[Sources]
01 General Fund $7,931,486 $28,846,446 $2,550,200 $31,396,646
05 Debt Service Fund 347,251 6,036,015 156,239 6,192,254
11 Economic Development Fund 1,233,023 1,405,000 - 1,405,000
12 Crime Control & Prevention District Fu 1,424,472 2,068,076 - 2,068,076
13 Oil and Gas Fund 1,659,644 315,000 - 315,000
14 Hotel/Motel Tax Fund 110,987 48,000 - 48,000
15 Court Security Fund 80,141 17,500 - 17,500
16 Court Technology Fund 31,550 21,000 - 21,000
17 Juvenile Case Manager Fund 111,271 29,500 - 29,500
18 Red Light Camera Fund 370,897 3,000 3,000
19 Grant Fund 200,757 94,500 - 94,500
20 PEG Fund 344,118 66,000 66,000
21 Fire Donation Fund 1,385 6,550 - 6,550
22 Library Donation Fund 235,327 33,300 - 33,300
23 Police Forfeiture Fund 66,148 19,500 - 19,500
24 Park Donation Fund 47,489 48,650 - 48,650
25 Park Dedication Fund 121,772 3,500 - 3,500
26 Safe Pathways Fund 66,524 2,250 - 2,250
27 Animal Shelter Fund 69,786 7,000 - 7,000
28 Police Donation Fund 60,112 40,700 - 40,700
29 Police CART Fund 5,511 120 - 120
31 Street Reconstruction Fund 14,467,498 3,250,000 - 3,250,000
32 Capital Improvement Fund 2,660,343 70,000 - 70,000
35 Capital Replacement Fund 755,844 750,000 - 750,000
39 Street Assessments Fund 23,980 400 - 400
41 Water & Sewer Fund 11,687,396 22,634,410 - 22,634,410
42 Water & Sewer Utility Projects Fund 3,218,730 120,000 7,397,633 7,517,633
44 Water and Sewer Impact Fees Fund 1,394,579 270,000 - 270,000
45 Drainage Utility Fund 813,466 1,845,000 - 1,845,000
46 Drainage Capital Projects Fund 888,582 25,000 905,000 930,000
Total 50,430,067 68,076,417 11,009,072 79,085,490
This schedule provides an overall view of the fiscal status for all of the funds utilized by City of
Haltom City. One can see at a glance the fund balance estimated for both the beginning and
end of the fiscal year in addition to the total amounts of fund sources and uses. More detailed
information for each fund is provided in a separate section of this document. See the table of
contents for the corresponding page.
Revenues are from a variety of sources such as taxes, fees, fines, utility sales and internal
transfers. Operating expenditures are generally represented as payments for consumable
supplies, services, salaries and other items related to the ongoing operations of each fund.
Capital Outlay is composed of equipment purchases, facility and infrastructure construction or
major renovations. Infrastructure generally refers to streets, water utilities, sewer utilities, and
drainage utilities. Non-cash items, such as depreciation, are included in the expenses, listed in
adjustment column, and added back in the fund balance.
Most funds are experiencing planned draw-downs of fund balance due to
expenditures/expenses higher than revenues. This structural imbalance should be corrected
in order to achieve financial stability and sustainablility.
Page 24