
Page 58 - Grapevine FY20 Approved Budget
P. 58
GENERAL GOVERNMENT LONG-RANGE FINANCIAL FORECAST
2017-18 2018-19 2019-20 2020-21 2021-22 2022-23
Actual Estimate Approved Projected Projected Projected
REVENUE AND OTHER FUNDING SOURCES
Taxes 52,721,297 55,680,221 57,788,528 61,782,701 61,761,411 62,156,287
Licenses, Fees & Permits 8,524,264 8,152,133 8,831,372 8,330,000 8,350,000 8,375,000
Fines, Forfeitures & Charges for Services 14,118,119 10,223,236 10,851,630 11,274,844 11,714,562 12,171,430
Interest & Miscellaneous 4,100,420 2,604,459 2,292,687 2,305,000 2,405,000 2,390,000
Transfers In 10,294,052 8,403,490 10,202,483 10,648,757 10,668,022 10,478,757
TOTAL SOURCES OF FUNDS 89,758,152 91,047,712 89,966,700 94,341,301 94,898,996 95,571,474
EXPENDITURES AND OTHER FUNDING USES
Personnel 32,096,812 32,053,473 34,466,915 35,647,407 36,868,331 38,131,071
Supplies, Maintenance & Services 16,101,355 16,901,070 17,074,990 17,617,240 18,144,857 18,688,303
Capital / Street Maintenance & Outlays 3,055,661 3,681,894 3,384,000 3,405,000 3,455,000 3,505,000
Insurance 12,125,821 5,987,403 8,891,956 9,425,473 9,991,002 10,590,462
Debt Service 15,620,341 15,852,315 15,705,883 14,536,812 13,176,443 11,984,312
Payments on Future Debt Issues 0 0 0 1,917,855 963,248 1,599,563
Transfers Out 9,424,200 9,076,630 10,515,828 9,800,000 9,850,000 9,900,000
TOTAL USES OF FUNDS 88,424,190 89,630,278 90,039,572 92,349,787 92,448,880 94,398,710
NET CHANGE IN FUND BALANCE 1,333,962 1,417,434 (72,872) 1,991,514 2,450,116 1,172,764
BEGINNING FUND BALANCE 16,531,379 17,865,341 19,282,775 19,209,903 21,201,417 23,651,533
ENDING FUND BALANCE 17,865,341 19,282,775 19,209,903 21,201,417 23,651,533 24,824,296
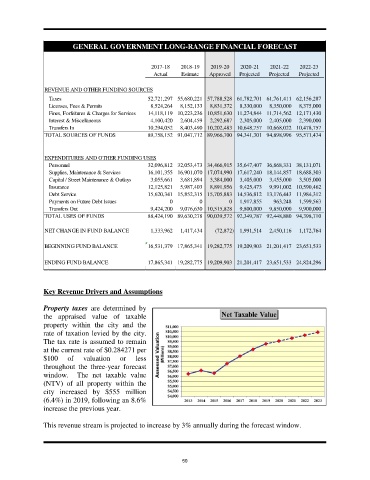
Key Revenue Drivers and Assumptions
Property taxes are determined by
the appraised value of taxable
property within the city and the
rate of taxation levied by the city.
The tax rate is assumed to remain
at the current rate of $0.284271 per
$100 of valuation or less
throughout the three-year forecast
window. The net taxable value
(NTV) of all property within the
city increased by $555 million
(6.4%) in 2019, following an 8.6%
increase the previous year.
This revenue stream is projected to increase by 3% annually during the forecast window.
50