
Page 339 - City of Bedford FY20 Approved Budget
P. 339
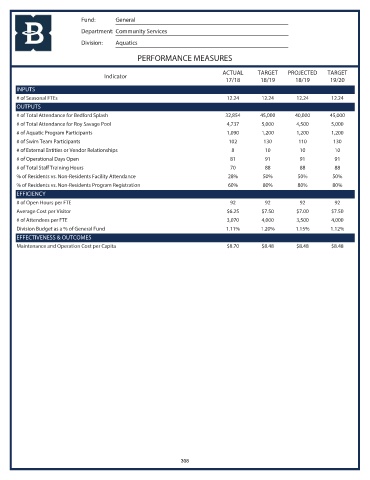
Fund:      General
                            Department: Community Services
                            Division:  Aquatics

                                               PERFORMANCE MEASURES

                                                                           ACTUAL     TARGET    PROJECTED    TARGET
                                    Indicator
                                                                            17/18      18/19       18/19      19/20
       INPUTS
       # of Seasonal FTEs                                                   12.24       12.24      12.24       12.24
       OUTPUTS
       # of Total Attendance for Bedford Splash                             32,854     45,000      40,000     45,000
       # of Total Attendance for Roy Savage Pool                            4,737       5,000      4,500       5,000
       # of Aquatic Program Participants                                    1,090       1,200      1,200       1,200
       # of Swim Team Participants                                           102        130         110        130
       # of External Entities or Vendor Relationships                         8          10         10          10
       # of Operational Days Open                                            81          91         91          91
       # of Total Staff Training Hours                                       70          88         88          88
       % of Residents vs. Non-Residents Facility Attendance                 28%         50%        50%         50%
       % of Residents vs. Non-Residents Program Registration                60%         80%        80%         80%
       EFFICIENCY
       # of Open Hours per FTE                                               92          92         92          92
       Average Cost per Visitor                                             $6.25       $7.50      $7.00       $7.50
       # of Attendees per FTE                                               3,070       4,000      3,500       4,000
       Division Budget as a % of General Fund                               1.11%      1.20%       1.15%      1.12%
       EFFECTIVENESS & OUTCOMES
       Maintenance and Operation Cost per Capita                            $8.70       $8.48      $8.48       $8.48


                                                             308