
Page 217 - City of Bedford FY20 Approved Budget
P. 217
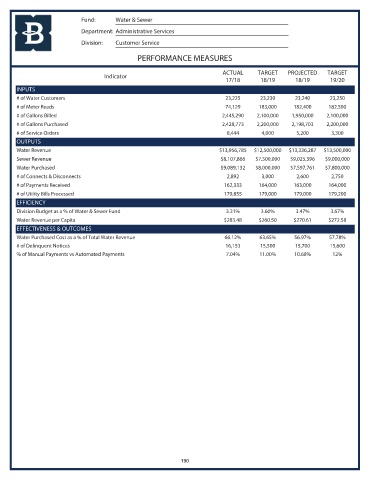
Fund:      Water & Sewer
                            Department: Administrative Services
                            Division:  Customer Service

                                               PERFORMANCE MEASURES

                                                                           ACTUAL     TARGET    PROJECTED    TARGET
                                    Indicator
                                                                            17/18      18/19       18/19      19/20
       INPUTS
       # of Water Customers                                                 23,225     23,230      23,240     23,250
       # of Meter Reads                                                     74,129     183,000    182,400     182,500
       # of Gallons Billed                                                2,445,290   2,100,000   1,950,000  2,100,000
       # of Gallons Purchased                                             2,428,773   2,200,000   2,198,703  2,200,000
       # of Service Orders                                                  8,444       4,000      5,200       3,300
       OUTPUTS
       Water Revenue                                                      $13,956,785  $12,500,000  $13,336,287  $13,500,000
       Sewer Revenue                                                      $8,107,866  $7,500,000  $9,025,396  $9,000,000
       Water Purchased                                                    $9,089,132  $8,000,000  $7,597,761  $7,800,000
       # of Connects & Disconnects                                          2,892       3,000      2,600       2,750
       # of Payments Received                                              162,333     164,000    163,000     164,000
       # of Utility Bills Processed                                        179,855     179,000    179,000     179,200
       EFFICIENCY
       Division Budget as a % of Water & Sewer Fund                         3.31%      3.60%       3.47%      3.67%
       Water Revenue per Capita                                            $283.48     $260.50    $270.61     $272.58
       EFFECTIVENESS & OUTCOMES
       Water Purchased Cost as a % of Total Water Revenue                  66.12%      63.65%     56.97%      57.78%
       # of Delinquent Notices                                              16,153     15,500      15,700     15,600
       % of Manual Payments vs Automated Payments                           7.04%      11.00%     10.68%       12%


                                                             190