
Page 156 - Microsoft Word - FY 2020 Adopted Budget Document
P. 156
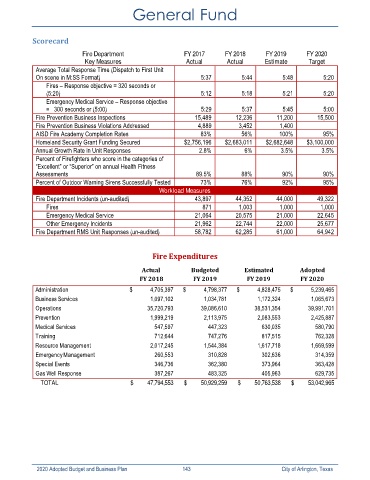
General Fund


            Scorecard
                            Fire Department                   FY 2017      FY 2018       FY 2019      FY 2020
                             Key Measures                      Actual       Actual       Estimate      Target
             Average Total Response Time (Dispatch to First Unit
             On scene in M:SS Format)                               5:37         5:44          5:48         5:20
                Fires – Response objective = 320 seconds or
                (5:20)                                              5:12         5:18          5:21         5:20
                Emergency Medical Service – Response objective
                =   300 seconds or (5:00)                           5:29         5:37          5:45         5:00
             Fire Prevention Business Inspections                15,489        12,236       11,200        15,500
             Fire Prevention Business Violations Addressed         4,889        3,452         1,400
             AISD Fire Academy Completion Rates                    83%           56%         100%           95%
             Homeland Security Grant Funding Secured          $2,756,196   $2,683,011    $2,682,648   $3,100,000
             Annual Growth Rate in Unit Responses                  2.8%           6%          3.5%         3.5%
             Percent of Firefighters who score in the categories of
             “Excellent” or “Superior” on annual Health Fitness
             Assessments                                          89.5%          88%          90%           90%
             Percent of Outdoor Warning Sirens Successfully  Tested  73%         76%          92%           95%
                                                      Workload Measures
             Fire Department Incidents (un-audited)              43,897        44,352       44,000        49,322
                Fires                                               871         1,003         1,000        1,000
                Emergency Medical Service                        21,064        20,575       21,000        22,645
                Other Emergency  Incidents                       21,962        22,744       22,000        25,677
             Fire Department RMS Unit Responses (un-audited)     58,782        62,285       61,000        64,942


                                                   Fire Expenditures

                                                Actual          Budgeted          Estimated         Adopted
                                               FY 2018           FY 2019           FY 2019          FY 2020
             Administration                 $                4,705,397  $                4,798,377  $                4,828,475  $                5,239,465
             Business Services                                1,097,102                    1,034,781                    1,172,324                    1,065,673
             Operations                                     35,720,793                  39,086,610                  38,531,354                  39,991,701
             Prevention                                       1,999,219                    2,113,975                    2,083,553                    2,425,887
             Medical Services                                    547,597                       447,323                       630,035                       580,790
             Training                                            712,644                       747,276                       817,515                       762,328
             Resource Management                              2,017,245                    1,544,384                    1,617,718                    1,669,599
             Emergency Management                                260,553                       310,828                       302,636                       314,359
             Special Events                                      346,736                       362,380                       373,964                       363,428
             Gas Well Response                                   387,267                       483,325                       405,963                       629,735
                 TOTAL                      $             47,794,553  $             50,929,259  $             50,763,538  $             53,042,965


             2020 Adopted Budget and Business Plan                                        143                                                                  City of Arlington, Texas