
Page 304 - Ord 866 Adopting a revised Fiscal Year 17-18 and new proposed Fiscal Year 18-19 budget
P. 304
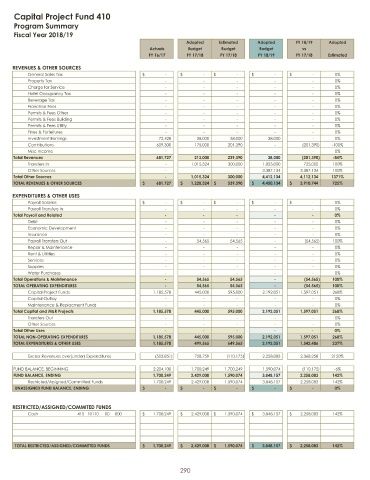
Capital Project Fund 410
     Program Summary
     Fiscal Year 2018/ 19
                                                              Adopted    Estimated    Adopted      FY 18/ 19  Adopted
                                                  Actuals      Budget     Budget       Budget        vs
                                                  FY 16/ 17    FY 17/ 18  FY 17/ 18   FY 18/ 19    FY 17/ 18  Estimated

     REVENUES &  OTHER SOURCES
          General Sales Tax -$                  -$                  -$                  -$                  -$                    0%
          Property Tax -                    -                    -                    -                    -                      0%
          Charge for Service -                    -                    -                    -                    -                      0%
          Hotel Occupancy  Tax -                    -                    -                    -                    -                      0%
          Beverage  Tax -                    -                    -                    -                    -                      0%
          Franchise Fees -                    -                    -                    -                    -                      0%
          Permits &  Fees Other -                    -                    -                    -                    -                      0%
          Permits &  Fees Building -                    -                    -                    -                    -                      0%
          Permits &  Fees Utility -                    -                    -                    -                    -                      0%
          Fines &  Forfeitures -                    -                    -                    -                    -                      0%
          Investment  Earnings                       72,428       38,000     38,000       38,000               -                      0%
          Contributions                              609, 300    175, 000   201, 390             -                    (  201, 390)            - 100%
          Misc Income -                    -                    -                    -                    -                      0%
     Total Revenues                                  681, 727    213, 000   239, 390      38, 000               (  201, 390)           - 84%
          Transfers In -                                        1,015, 324  300, 000    1,025, 000   725, 000  100%
          Other Sources -                    -                    -                      3,387, 134  3,387, 134  100%
     Total Other Sources -                                      1,015, 324  300, 000    4,412, 134  4,112, 134  1371%
     TOTAL REVENUES &   OTHER SOURCES                681, 727$             1,228, 324$          539, 390$             4,450, 134$          3,910, 744$          725%
     EXPENDITURES &  OTHER USES
          Payroll Salaries -$                  -$                  -$                  -$                  -$                    0%
          Payroll Transfers In -                    -                    -                    -                    -                      0%
     Total Payroll and Related -                    -                    -                    -                    -                      0%
          Debt -                    -                    -                    -                    -                      0%
          Economic  Development -                    -                    -                    -                    -                      0%
          Insurance -                    -                    -                    -                    -                      0%
          Payroll Transfers Out -                                 54,565     54,565               -                    (  54,565)              100%
          Repair &  Maintenance -                    -                    -                    -                    -                      0%
          Rent &  Utilities -                    -                    -                    -                    -                      0%
          Services -                    -                    -                    -                    -                      0%
          Supplies -                    -                    -                    -                    -                      0%
          Water Purchases -                    -                    -                    -                    -                      0%
     Total Operations &  Maintenance -                            54, 565    54, 565               -                    (  54, 565)              100%
     TOTAL OPERATING  EXPENDITURES  -                             54, 565    54, 565               -                    (  54, 565)              100%
          Capital Project Funds                     1,185, 578   445, 000   595, 000    2,192, 051  1,597, 051  268%
          Capital Outlay -                    -                    -                    -                    -                      0%
          Maintenance &   Replacment  Funds -                    -                    -                    -                    -                      0%
     Total Capital and M&R Projects                 1,185, 578   445, 000   595, 000    2,192, 051  1,597, 051  268%
          Transfers Out -                    -                    -                    -                    -                      0%
          Other Sources -                    -                    -                    -                    -                      0%
     Total Other Uses -                    -                    -                    -                    -                      0%
     TOTAL NON- OPERATING  EXPENDITURES             1,185, 578   445, 000   595, 000    2,192, 051  1,597, 051  268%
     TOTAL EXPENDITURES &   OTHER USES              1,185, 578   499, 565   649, 565    2,192, 051  1,542, 486  237%

          Excess Revenues  over( under)  Expenditures (  503, 851)              728, 759             (  110, 175)              2,258, 083  2,368, 258  2150%

     FUND BALANCE,  BEGINNING                       2,204, 100  1,700, 249  1,700, 249  1,590, 074          (  110, 175)            -  6%
     FUND BALANCE,  ENDING                          1,700, 249  2,429, 008  1,590, 074  3,848, 157  2,258, 083  142%
          Restricted/ Assigned/ Committed  Funds    1,700, 249  2,429, 008  1,590, 074  3,848, 157  2,258, 083  142%
      UNASSIGNED  FUND BALANCE,  ENDING -$                  -$                  -$                  -$                  -$                    0%


     RESTRICTED/ ASSIGNED/ COMMITED FUNDS
          Cash             410 10110  00  000       1,700,249$          2,429,008$         1,590,074$          3,848,157$          2,258,083$         142%


      TOTAL RESTRICTED/  ASSIGNED/ COMMITTED  FUNDS  1,700, 249$          2,429, 008$          1,590, 074$          3,848, 157$          2,258, 083$          142%


                                                             290