Page 300 - Ord 866 Adopting a revised Fiscal Year 17-18 and new proposed Fiscal Year 18-19 budget
P. 300

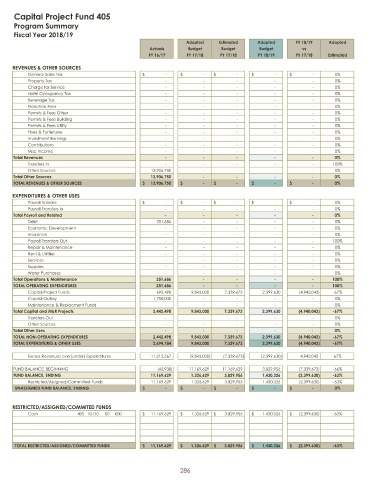
Capital Project Fund 405
     Program Summary
     Fiscal Year 2018/ 19
                                                              Adopted    Estimated    Adopted      FY 18/ 19  Adopted
                                                  Actuals      Budget     Budget       Budget        vs
                                                  FY 16/ 17    FY 17/ 18  FY 17/ 18   FY 18/ 19    FY 17/ 18  Estimated

     REVENUES &  OTHER SOURCES
          General Sales Tax -$                  -$                  -$                  -$                  -$                    0%
          Property Tax -                    -                    -                    -                    -                      0%
          Charge for Service -                    -                    -                    -                    -                      0%
          Hotel Occupancy  Tax -                    -                    -                    -                    -                      0%
          Beverage  Tax -                    -                    -                    -                    -                      0%
          Franchise Fees -                    -                    -                    -                    -                      0%
          Permits &  Fees Other -                    -                    -                    -                    -                      0%
          Permits &  Fees Building -                    -                    -                    -                    -                      0%
          Permits &  Fees Utility -                    -                    -                    -                    -                      0%
          Fines &  Forfeitures -                    -                    -                    -                    -                      0%
          Investment  Earnings -                    -                    -                    -                    -                      0%
          Contributions -                    -                    -                    -                    -                      0%
          Misc Income -                    -                    -                    -                    -                      0%
     Total Revenues -                    -                    -                    -                    -                      0%
          Transfers In -                    -                    -                    -                    -                      100%
          Other Sources                            13,906, 750        -                    -                    -                    -                      0%
     Total Other Sources                           13, 906, 750        -                    -                    -                    -                      0%
     TOTAL REVENUES &   OTHER SOURCES              13, 906, 750$      -$                  -$                  -$                  -$                    0%
     EXPENDITURES &  OTHER USES
          Payroll Salaries -$                  -$                  -$                  -$                  -$                    0%
          Payroll Transfers In -                    -                    -                    -                    -                      0%
     Total Payroll and Related -                    -                    -                    -                    -                      0%
          Debt                                       251, 686             -                    -                    -                    -                      0%
          Economic  Development -                    -                    -                    -                    -                      0%
          Insurance -                    -                    -                    -                    -                      0%
          Payroll Transfers Out -                    -                    -                    -                    -                      100%
          Repair &  Maintenance -                    -                    -                    -                    -                      0%
          Rent &  Utilities -                    -                    -                    -                    -                      0%
          Services -                    -                    -                    -                    -                      0%
          Supplies -                    -                    -                    -                    -                      0%
          Water Purchases -                    -                    -                    -                    -                      0%
     Total Operations &  Maintenance                 251, 686             -                    -                    -                    -                      100%
     TOTAL OPERATING  EXPENDITURES                   251, 686             -                    -                    -                    -                      100%
          Capital Project Funds                      692, 498   9,843, 000  7,339, 673  2,399, 630          (  4,940, 043)         -  67%
          Capital Outlay                            1,750, 000          -                    -                    -                    -                      0%
          Maintenance &   Replacment  Funds -                    -                    -                    -                    -                      0%
     Total Capital and M&R Projects                 2,442, 498  9,843, 000  7,339, 673  2,399, 630          (  4,940, 043)        -  67%
          Transfers Out -                    -                    -                    -                    -                      0%
          Other Sources -                    -                    -                    -                    -                      0%
     Total Other Uses -                    -                    -                    -                    -                      0%
     TOTAL NON- OPERATING  EXPENDITURES             2,442, 498  9,843, 000  7,339, 673  2,399, 630          (  4,940, 043)        -  67%
     TOTAL EXPENDITURES &   OTHER USES              2,694, 184  9,843, 000  7,339, 673  2,399, 630          (  4,940, 043)        -  67%

          Excess Revenues  over( under)  Expenditures  11,212, 567        (  9,843, 000)         (  7,339, 673)         (  2,399, 630)           4,940, 043  67%

     FUND BALANCE,  BEGINNING (                      42,938)               11,169, 629  11,169, 629  3,829, 956          (  7,339, 673)         -  66%
     FUND BALANCE,  ENDING                         11, 169, 629  1,326, 629  3,829, 956  1,430, 326          (  2,399, 630)        -  63%
          Restricted/ Assigned/ Committed  Funds   11,169, 629  1,326, 629  3,829, 956  1,430, 326          (  2,399, 630)         -  63%
      UNASSIGNED  FUND BALANCE,  ENDING -$                  -$                  -$                  -$                  -$                    0%


     RESTRICTED/ ASSIGNED/ COMMITED FUNDS
          Cash             405 10110  00  000      11,169,629$        1,326,629$         3,829,956$          1,430,326$        (  2,399,630)$       - 63%


      TOTAL RESTRICTED/  ASSIGNED/ COMMITTED  FUNDS  11, 169, 629$        1,326, 629$          3,829, 956$          1,430, 326$        (  2,399, 630)$       -  63%


                                                             286
   295   296   297   298   299   300   301   302   303   304   305