
Page 233 - Ord 866 Adopting a revised Fiscal Year 17-18 and new proposed Fiscal Year 18-19 budget
P. 233
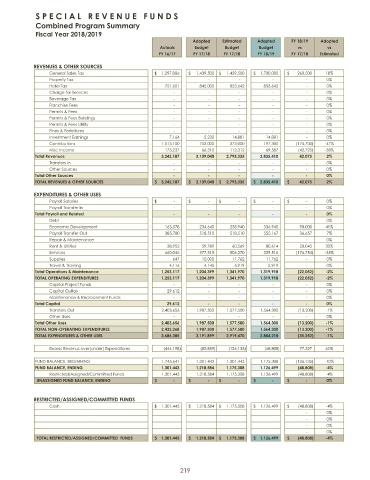
S P E C I A L R E V E N U E F U N D S
             Combined Program Summary
             Fiscal Year 2018/ 2019
                                                                 Adopted  Estimated   Adopted    FY 18/ 19  Adopted
                                                      Actuals    Budget    Budget      Budget      vs        vs
                                                      FY 16/ 17  FY 17/ 18  FY 17/ 18  FY 18/ 19  FY 17/ 18  Estimated
            REVENUES &  OTHER SOURCES
                 General Sales Tax                    1,297,086$       1,439,500$       1,439,500$       1,700,000$       260,500$         18%
                 Property Tax -                 -                  -                  -                 -                   0%
                 Hotel Tax                             751,601     845,000   853,642    853,642          -                   0%
                 Charge for Services -                 -                  -                  -                 -                   0%
                 Beverage Tax -                 -                  -                  -                 -                   0%
                 Franchise Fees -                 -                  -                  -                 -                   0%
                 Permits &  Fees -                 -                  -                  -                 -                   0%
                 Permits &  Fees Buildings -                 -                  -                  -                 -                   0%
                 Permits &  Fees Utility -                 -                  -                  -                 -                   0%
                 Fines &  Forfeitures -                 -                  -                  -                 -                   0%
                 Investment Earnings                     7,164      5,230     14,881     14,881            -                   0%
                 Contributions                        1,013, 100   753, 000  373, 000   197, 300          (  175, 700)        -  47%
                 Misc Income                           173, 237     66, 310  112, 312    69,587            (  42, 725)          - 38%
             Total Revenues                           3,242, 187  3,109, 040  2,793, 335  2,835, 410  42,075  2%
                 Transfers In -                 -                  -                  -                 -                   0%
                 Other Sources -                 -                  -                  -                 -                   0%
             Total Other Sources -                 -                 -                 -                 -                   0%
             TOTAL REVENUES &   OTHER SOURCES         3,242, 187$       3,109, 040$       2,793, 335$       2,835, 410$       42,075$           2%

            EXPENDITURES &  OTHER USES
                 Payroll Salaries -$               -$                -$                -$               -$                 0%
                 Payroll Transfer In -                 -                  -                  -                 -                   0%
             Total Payroll and Related -                 -                 -                 -                 -                   0%
                 Debt -                 -                  -                  -                 -                   0%
                 Economic  Development                 163, 578    234, 640  238, 940   336, 940    98, 000  41%
                 Payroll Transfer Out                  385, 780    518, 510  518, 510   555, 167    36, 657  7%
                 Repair &  Maintenance -                 -                  -                  -                 -                   0%
                 Rent &  Utilities                      38, 952     59, 789   60, 569    80,614     20, 045  33%
                 Services                              660, 046    377, 315  506, 270   329, 516          (  176, 754)        -  35%
                 Supplies                                 647       10, 000   11, 762    11,762            -                   0%
                 Travel &  Training                      4,116      4,145     5,919       5,919             -                   0%
             Total Operations &  Maintenance          1,253, 117  1,204, 399  1,341, 970  1,319, 918      (  22,052)          -  2%
             TOTAL OPERATING  EXPENDITURES            1,253, 117  1,204, 399  1,341, 970  1,319, 918      (  22,052)          -  2%
                 Capital Project Funds -                 -                  -                  -                 -                   0%
                 Capital Outlay                         29, 612            -                  -                  -                 -                   0%
                 Maintenance &   Replacement  Funds -                 -                  -                  -                 -                   0%
             Total Capital                              29, 612           -                 -                 -                 -                   0%
                 Transfers Out                        2,403, 656  1,987, 500  1,577, 500  1,564, 300       (  13, 200)          -  1%
                 Other Uses -                 -                  -                  -                 -                   0%
             Total Other Uses                         2,403, 656  1,987, 500  1,577, 500  1,564, 300      (  13,200)          -  1%
             TOTAL NON- OPERATING  EXPENDITURES       2,433, 268  1,987, 500  1,577, 500  1,564, 300      (  13,200)          -  1%
             TOTAL EXPENDITURES &   OTHER USES        3,686, 385  3,191, 899  2,919, 470  2,884, 218      (  35,252)          -  1%

                 Excess Revenus over( under)  Expenditures (  444, 198)        (  82, 859)           ( 126, 135)         (  48,808)            77, 327  61%
             FUND BALANCE,  BEGINNING                 1,745, 641  1,301, 443  1,301, 443  1,175, 308       (  126, 135)        -  10%
             FUND BALANCE,  ENDING                    1,301, 443  1,218, 584  1,175, 308  1,126, 499      (  48,808)          -  4%
                 Restricted/ Assigned/ Committed  Funds  1,301, 443  1,218, 584  1,175, 308  1,126, 499       (  48, 808)          -  4%
             UNASSIGNED  FUND BALANCE,  ENDING -$               -$               -$               -$               -$                 0%


            RESTRICTED/ ASSIGNED/ COMMITTED FUNDS
                 Cash                                 1,301, 443$       1,218, 584$       1,175, 308$       1,126, 499$     (  48, 808)$        -  4%
                                                                                                             0%
                                                                                                             0%
                                                                                                             0%
                                                                                                             0%
             TOTAL RESTRICTED/ ASSIGNED/ COMMITTED FUNDS  1,301,443$       1,218,584$       1,175,308$       1,126,499$     (  48,808)$        - 4%


                                                             219