
Page 77 - Mansfield 2019 Operating Budget
P. 77
MAJOR REVENUES
General Fund
City revenues are based on a combination of factors including analysis of historical revenue, anticipated
changes in the local economic environment and projected growth and development throughout the City.
The City of Mansfield also uses a variety of factors in determining the availability of revenue to fund
operations throughout the City, including but not limited to qualitative and quantitative revenue
forecasting, trend analysis, time series analysis, multi-year historical data, national, state and local
economic trends, undeveloped land, actual and proposed development, quantitative and qualitative
factors including plats, building permits and the Long Term Financial Plan.
In FY 2018-2019, the City has aggressively estimated revenues based on current residential and
commercial developments approved by City Council, robust economic development efforts and increased
commercial and residential developments within the City. Development in the medical corridor and the
southern portion of the City are expected to continue in FY 2018-2019. Residential and commercial
property valuations have followed recent local, state and national trends.
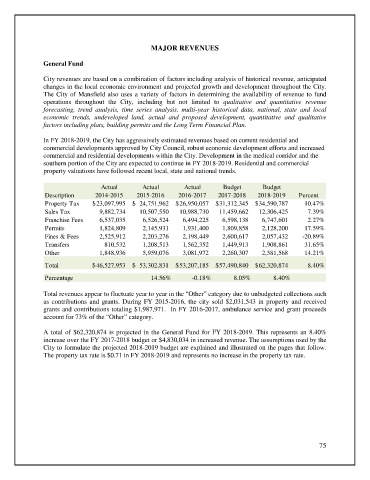
Actual Actual Actual Budget Budget
Description 2014-2015 2015-2016 2016-2017 2017-2018 2018-2019 Percent
Property Tax $ 23,097,995 $ 24,751,962 $ 26,950,057 $ 31,312,345 $ 34,590,787 10.47%
Sales Tax 9,882,734 10,507,550 10,988,730 11,459,662 12,306,425 7.39%
Franchise Fees 6,537,035 6,526,524 6,494,225 6,598,138 6,747,601 2.27%
Permits 1,824,809 2,145,931 1,931,400 1,809,858 2,128,200 17.59%
Fines & Fees 2,525,912 2,203,276 2,198,449 2,600,617 2,057,432 -20.89%
Transfers 810,532 1,208,513 1,562,352 1,449,913 1,908,861 31.65%
Other 1,848,936 5,959,076 3,081,972 2,260,307 2,581,568 14.21%
Total $ 46,527,953 $ 53,302,831 $ 53,207,185 $ 57,490,840 $ 62,320,874 8.40%
Percentage 14.56% -0.18% 8.05% 8.40%
Total revenues appear to fluctuate year to year in the “Other” category due to unbudgeted collections such
as contributions and grants. During FY 2015-2016, the city sold $2,031,543 in property and received
grants and contributions totaling $1,987,971. In FY 2016-2017, ambulance service and grant proceeds
account for 73% of the “Other” category.
A total of $62,320,874 is projected in the General Fund for FY 2018-2019. This represents an 8.40%
increase over the FY 2017-2018 budget or $4,830,034 in increased revenue. The assumptions used by the
City to formulate the projected 2018-2019 budget are explained and illustrated on the pages that follow.
The property tax rate is $0.71 in FY 2018-2019 and represents no increase in the property tax rate.
75